Friday, May 29, 2009

Holiday – Vacance – Urlaub – Vakantie – Semester – праздник - Maintenance Mode

For the next three weeks this blog will be silent since I am on holiday or, to put it  into OpsMgr related terms, I will be in Maintenance Mode.

Thanks for all your visits/comments to this blog and we’ll meet again after three weeks. With OpsMgr R2 there will certainly be a lot to blog about.

Bye,
Marnix

Thursday, May 28, 2009

Workaround for Service Level Tracking in OpsMgr R2

When Service Level Tracking in OpsMgr R2 is being used, and the summary report is run, the wrong parameters may be passed when drilling down in this report to the Service Level Object Detail report.

As a result, the wrong Service Level will be displayed.

As KB971406 states:
image 
Hopefully a hotfix will soon come out to address this issue.

Hotfix for OpsMgr R2 available

Microsoft has released a hotfix for OpsMgr SP1 environments upgraded to OpsMgr R2.

KB971233
This hotfix solves an issue where the console shows customized subscriptions. These subscriptions resemble the following under the Administration\Notifications\Subscriptions\Subscription Name node: SMTP{GUID}

This hotfix contains a sql-script which must be run against the OpsMgr database.

Read the instructions carefully in this KB before applying it.

What does Windows Server 2008 need in order to run OpsMgr R2?

Windows 2008 Server needs three hotfixes before OpsMgr R2 will run smoothly on it.

KB971504 tells all about it.

(The same hotfixes are needed as well when running OpsMgr SP1 on Windows 2008 Server)

OpsMgr R2: What has been fixed?

An impressive list it is!

Check it out: http://support.microsoft.com/?kbid=971410

OpsMgr R2 RTM: upgrade paths and -tasks

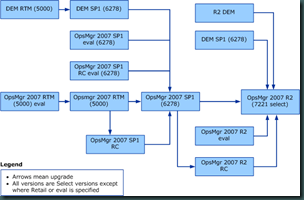
The Upgrade Guide – online version to be found here - contains valuable information about what kind of upgrade paths to OpsMgr R2 RTM are supported.

When in doubt about a certain upgrade path, post your question on the OpsMgr Online Forum BEFORE starting the upgrade. http://social.technet.microsoft.com/Forums/en-US/category/systemcenteroperationsmanager

From OpsMgr SP1 to R2 RTM
When the OpsMgr environment is at SP1 level you can upgrade directly to R2.

From OpsMgr RTM to R2 RTM
Sometimes I bump into OpsMgr environments which are still at RTM level. These environments can't be upgraded directly to R2. First SP1 needs to be applied before an upgrade to R2 is possible.

From OpsMgr R2 RTM Eval to R2 RTM
You can upgrade directly to R2 RTM full version.

From OpsMgr R2 RC Select R2 RTM Eval
Not possible. Wait for the R2 RTM Select to perform an inplace upgrade. Look here for the information from the community.

Diagram of available upgrade paths
image 
Tasks to be completed BEFORE the upgrade

  • A valid backup of the of the OpsMgrdatabases.
    (OpsMgr, DW & MasterDB, it contains entries for SCOM)
    .
  • Backup EncryptionKey (write down the password!).

  • Export Unsealed MPs.

  • Remove Agents from Pending.

  • Increase available space for data and logfiles of SCOMDBs to 50% or more.

  • Remove Agents from systems with standalone consoles.

  • Remove Agent from the SRS server hosting the OpsMgr reports.

  • Disable notification subscriptions.

  • Disable Connectors (if applicable).

  • Write down all usernames and passwords used by OpsMgr for ‘just-in-case’.
    (Action, SDK, DW Read, DW Write)

Speeding up the upgrade
Nice thing is to run a stored procedure on the SQL-server hosting the SCOM-databases, which will speed up the upgrade process:image 
Running upgrade using RDP connections
When the upgrade is done on the servers through a RDP session it is important to run it with the switches which makes it a Console session. Otherwise the logfiles – made during the upgrade – will be lost when the system restarts.

  • Windows 2003 / XP: mstsc.exe /console
  • Windows 2008 / Vista / 7: mstsc.exe /admin

Upgrade order

  1. RMS
  2. Reportingserver (performed on SRS server, remove OpsMgr Agent when present).
  3. Standalone OpsMgr Consoles
  4. Management Servers
  5. Gateway Servers
  6. Agents
  7. WebConsole

And - if applicable - the ACS Collector with the ACS-database

Special thanks to Graham Davies who warned for some pitfalls.

Tuesday, May 26, 2009

Unpacking msi-files of Management Packs

In OpsMgr R2 this ‘problem’ is gone – since one can download and import MPs directly from the console – but until OpsMgr SP1 downloading and unpacking the msi-files containing the MPs can take some time.

Be aware though that with OpsMgr R2 the MP guide is still needed. Read this posting how to go about it.

Mostly because the MPs are packaged as a msi-file. When one runs this file the local msi-database gets filled up with all kind of unneeded information about installed programs which are mostly unpacked MPs.

With a free MSI-editor/-unpacker/-viewer the installation of the msi-file isn’t needed. Simply run the MSI-editor/-unpacker/-viewer, open the msi-file and in the same folder where the msi-file resides a new folder will be created, containing all files which are to be found within the msi-file, without filling-up the local msi-database with all kinds of unneeded information.

This free tool can be downloaded here. I have used it on Windows Vista without any problems and now I use it on Windows 7 as well, also without any problems.

Monday, May 25, 2009

OpsMgr R2 goes green

With OpsMgr R2 RTM it is possible to collect information about the power being used by the monitored computers. This is done with the

Power Consumption Collection Feature

Reports can be created as well, including the power consumption for each computer or for a group of computers.

The monitored system must be a Windows 2008 server R2 or Windows 7 client. These systems must be attached to a PDU (Power Distribution Unit) as well.

Before this feature is available in OpsMgr R2, the Power Management Library management pack must be imported. With this MP a new type of monitor comes available: Power Consumption.

With this monitor the Power Consumption can be monitored.

I hope to be able to test it. As soon as I get some results I will post them on my blog.

OpsMgr R2 documentation

With R2 going RTM, new documentation has been released as well.

Here are the locations where the documentation can be found:

  1. Online Documentation
    http://technet.microsoft.com/en-us/library/dd887701.aspx

  2. R2 Product Documentation
    http://technet.microsoft.com/en-us/opsmgr/bb498235.aspx

  3. R2 Release Notes
    http://technet.microsoft.com/en-us/library/dd827187.aspx

  4. Preparing to upgrade to R2
    http://technet.microsoft.com/en-us/library/dd789074.aspx

  5. R2 Upgrade Guide
    http://technet.microsoft.com/en-us/library/dd861348.aspx

  6. Upgrading SQL 2005 to SQL 2008
    http://technet.microsoft.com/en-us/library/dd789004.aspx

Saturday, May 23, 2009

The end of the NNTP newsgroups for OpsMgr

With OpsMgr R2 going RTM Microsoft also launched the ‘New Way’ for the OpsMgr community. No more NNTP but all web based.

Check it out here.

Friday, May 22, 2009

OpsMgr versions

With multiple OpsMgr 2007 versions being around it can be hard to tell what version one is exactly using.

Therefore I have made a small overview of the available OpsMgr versions:

  1. RC, version 6.0.6246.0
  2. RTM, version 6.0.5000.0
  3. SP1, version 6.0.6278.0
  4. R2 Beta 1, version 6.1.6407.0
  5. R2 RC, version 6.1.7043.0
  6. R2 RTM, version 6.1.7221.0

By running a sql-query (*) on the OperationsManager database the OpsMgr version can be easily found:

select DBVersion from __MOMManagementGroupInfo__

(*: This query - with many other useful queries - can be found in this blog article of Kevin Holman.)

OpsMgr R2 RTM

Just heard the news:

today the RTM of OpsMgr R2 is released.

Fast facts:

  • RTM is build 7221.
  • General availability 1st of july.
  • Evaluation version to be downloaded here.
  • Monitoring Linux/Unix with OpsMgr R2.
  • Tracking Service Levels with R2.
  • Interoperability Connectors for OpsMgr.
  • Improved performance (servers, console and so on).

On Microsoft Connect more information can be found as well.

How to configure a gateway to communicate with a different management server without moving agents

The Operations Manager Support Team has posted a very good article on their blog today.

It tells how to configure a Gateway Server to communicate with a different Management Server.

I tested it in a testenvironment of mine and it works great.

Article to be found here.

New Hotfix for OpsMgr SP1 available

Microsoft has just released a new hotfix for OpsMgr SP1:

KB968082
This hotfix solves an issue with the Auto Agent Assignment option in OpsMgr. When this is used in an AD domain with a name that starts with a digit, this errormessage is shown:

XSD verification failed for management pack. [Line: 53, Position: 13]

Wednesday, May 20, 2009

Notifications Update Alert History Tool

The OpsMgr Team also released another useful tool for notifications:

The Notifications Update Alert History Tool.

Also a must-have.To be downloaded here.

Notification Test Tool

The OpsMgr Team just released a very nice tool, a real must-have:

The Notification Test Tool.

To be downloaded here.

Removing AEM (Agentless Exception Monitoring)

Beware. The tool mentioned here is to be used at your own risk. This is provided "AS IS" with no warranties, and confers no rights.

At a customers site AEM was in use. However, the customer decided not to use it anymore. So AEM had to be disabled.

The first steps in this process are pretty straight forward. The GPO which tells the client to forward the events to server responding to the AEM requests, has to be disabled.

Then the SCOM Management Server(s) running this feature (Client Monitoring) have to be adjusted. In the SCOM Console go to the Administration pane, Management Servers. Right click the Management Server where this feature is enabled and select ‘Disable Client Monitoring’.

Now one tends to think all is well. As a matter of a fact it is. But when one opens the SCOM Console, Monitoring pane and checks the folder ‘Agentless Exeception Monitoring’, ‘Application View’  a lot of data will be present in this View.

This is because most data is still in the Data Warehouse, and it will stay there for a long long time by default. (raw data 30 days, aggregated data 400 days).

How neat would it be when this data, and ONLY this data could be groomed out much earlier.

Running this query against the OperationsManagerDW database shows these default settings (Thanks to Kevin Holman for providing this sql-query):

Query:

SELECT AggregationTypeID, BuildAggregationStoredProcedureName, GroomStoredProcedureName, MaxDataAgeDays, GroomingIntervalMinutes

FROM StandardDatasetAggregation WHERE BuildAggregationStoredProcedureName = 'AemAggregate'

Output:
200509_01 
Where the grooming settings for the OpsMgr database are easily to be adjusted by the SCOM Console, this is not the case for the Data Warehouse database.

So after a bit searching I found this tool made by Daniel Savage.

And after some testing (in one of mine SCOM test environments) I changed these settings to 1 day (raw data) and 10 days (daily aggregations).

Now the output of the earlier mentioned sql-query shows this information:
200509_02  
This is way much better. The AEM data will be gone within two weeks!

Thanks to Daniel Savage for the tool and Kevin Holman for the query.

New KB article: The _PrimarySG_ security group is repopulated every hour

A hotfix for SCOM SP1 is available for download, which solves this issue:

When the Active Directory Auto Agent Assignment feature of System Center Operations Manager 2007 is enabled, event 11470 is logged every hour on the Root Management Server. This symptom occurs because the <Server>_PrimarySG_<number> security group is repopulated when Active Directory is requeried.

KB967843 describes this issue and has a hotfix for download.

Monday, May 18, 2009

Restoring SRS (SQL Reporting Services) : Transaction (Process ID xx) was deadlocked on lock resources with another process…

Even though the reportingcomponent of SCOM is a robust solution, sometimes it gets broken. Then a repair is needed in order to make it work again. Many times the underlying SRS component is not OK anymore. There are multiple ways to go about it, but sometimes SRS needs a reset before other correcting actions will work.

The installationmedia for SCOM has a tool for which brings SRS back to it’s state before SCOM Reporting was installed, ResetSRS.exe, located in the folder ~\SupportTools\<systemarchitecture>\.

Just running this tool is not sufficient. Afterwards other steps must to be taken as well, like running the installation of SCOM Reporting again (make sure to connect to the ‘old’ Data Warehouse database !).

However, running this tool might reveal other issues at hand as well. For instance this message might show up when running this tool:180509_01
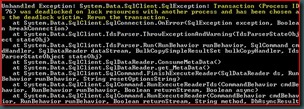
First check the database (ReportServer) on the SQL-server hosting this database. Big change this database has entered Single User mode:
180509_02

But just running this query ‘ALTER DATABASE ReportServer SET MULTI_USER’ to make the database Multi-User again will not work. Before running it make sure to stop the related SRS service. Now this database will accept this query.

Now run the ResetSRS.exe tool. When all is well this output will be generated:
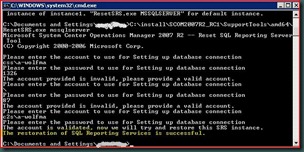
180509_03

Now open IE on the SRS server and type in this url: ‘http://localhost/reports’. When all is well this will be shown (it can take a while before it is loaded since the Application Pool has been restarted):
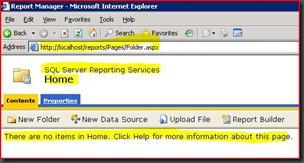
180509_04

Now the basis (SRS) for SCOM Reporting is Up & Running again and the other actions to make SCOM Reporting work again can be taken.

Friday, May 15, 2009

SCOM R2: Service Level Dashboard

Even though SCOM R2 already contains a good working solution for Service Level Tracking (look here for a blog posting of mine about it), Microsoft released an additional solution for it, named the Service Level Dashboard (SLD), to be downloaded via Microsoft Connect.

There is much to tell so let’s start. For the answers of the questions I have used the SLD document a bit.

Question 1: What does it add compared to the default solution already available in SCOM R2?

This solution is built on Windows SharePoint Services 3.0 and designed in such a way to work in conjunction with SCOM R2, configured to monitor business critical applications. When the SLD components are correctly configured and operating, the dashboard displays – almost real-time at 2 to 3 minutes (!) – summarized data about the service levels.

So this solution combines the strengths of SharePoint and SCOM. Besides that, no more need for a manager to request access to SCOM in order to know whether the SLA’s are being met, since the measured results are available in SharePoint.

Question 2: How does it work?

In SCOM one defines the service level goals (named Service Level Objectives, or SLOs in SCOM) against an application or group of objects. Here the service level targets are set as well.

The SLD evaluates each SLO over a defined time period and decides whether it met its goal or not.

The dashboard displays each SLO and identifies its states based on the defined service level targets. The dashboard can display a maximum of six different applications or groups.

Question 3: What does the dashboard summarize?

  • Current status & health of all defined SLOs
  • Service Level Metrics
  • Mean Time To Repair (MTTR)
  • Mean Time Between Failures (MTBF)
  • Service Level Trends

Process Flow of the SLD:
(picture taken from SLD document)

image

Requirements
Of course a working SCOM R2 environment is needed. Besides that:

  • SharePoint Services 3.0 (SQL Embedded won’t work)
  • SCOM Reporting (Data Warehouse database)
  • .NET framework 3.5
  • A good translation of the SLAs to SLOs in SCOM
  • Good knowledge of SharePoint Services 3.0
  • Good knowledge of SCOM R2

Quick Guide
Here is described how this solution is installed, configured and some SLOs are built and displayed in SharePoint. This quick guide presumes SharePoint 3.0 is already present, configured and in working condition.
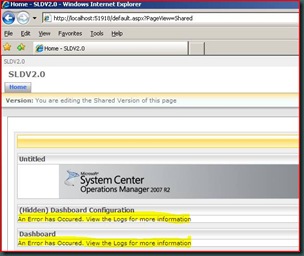
  • Import the SLD MP in SCOM (only one file)
  • Run the SLD wizard on a server where SharePoint 3.0 Central Administration is installed
  • Follow the steps in the installation wizard
  • Open the SLD site after the installation to see all is well. When this is displayed something is wrong…
    clip_image002
    All is well when this is being displayed:
    clip_image002[5]
  • In the SCOM Console, built one or more Service Level Tracking Management Pack Object(s). (Authoring –> Management Pack Objects –> Service Level Tracking). Of course one can built a Web Application first, use this component in a Distributed Application and target a SLO against it.
  • Now open the SLD SharePoint Site and configure it to display the SLOs:

    The SLOs to be displayed are selected:
    150509_02
    150509_03
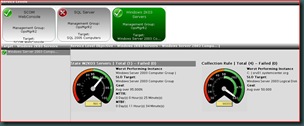
    The Windows 2003 Servers meet their agreed SLA:
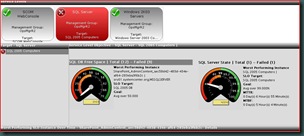
    Oops! The SQL-servers don’t meet their SLA:
    150509_04
    150509_05
    The earlier mentioned MTTR and MTBF:
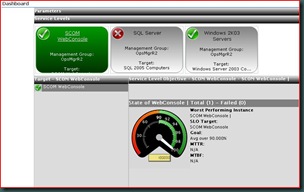
    The SCOM WebConsole is also under surveillance:
    150509_06

Conclusion
With this new solution – even though it is still in beta – Microsoft has shown its dedication to SCOM/OpsMgr. It delivers added value for many organizations and combines the strength of SharePoint Services 3.0 and SCOM R2.

Now managers can see – almost real-time – how the Business Critical systems/applications are performing and whether they meet the SLAs.

With this a good tooling has been brought to the market which enables businesses to get a good insight of their processes and their weakest links.

Even though this solution is rather easy to implement one must realize that the most of the time needed to make this work is a good translation of the SLAs to the SLOs in SCOM/OpsMgr.

Otherwise one is looking at a nice dashboard but getting wrong information.

Therefore preparation is the keyword for which most preparation must be done at the organizational level instead of the technical level. Only than this solution will live up to its promises.

Since this SLD is tightly integrated with SharePoint, it can use it’s security as well. Therefore the dashboards can be separated from each other. So customer X can only see his/her related dashboard and customer Y can only see his/her dashboard.

For companies using SCOM as a hosted service, this is a huge advantage. Their customers can now see how their systems are performing.

Special thanks
It took me a while to get everything working. As stated before in an earlier blog posting of mine, this wasn’t because of the solution but because of problems within my SCOM test environment and a shortage in my knowledge of SharePoint.

The Program Manager for this solution, Raghu Kethineni, has been of great help to me for making this work. Thanks Raghu!

SCOM R2 RC: Discovery of computers

In SCOM SP1 the discovery wizard of servers/clients could be running on for ever.

Finding the reason behind this never ending discovery process could take some time. Mostly it turned out that the SQL Broker Service wasn’t running. And this service is needed for the discovery of servers/clients.

In SCOM R2 Microsoft has addressed this issue. Yes, the SQL Broker Service still needs to be in a running state but now the wizard shows this screen:

150509_01

So when a discovery keeps running on with no end, one now knows what it can cause. Of course there might be another reason for it but more than 90% of the time, the SQL Broker Service – not running - is the culprit.

Even though it is nothing more than a small cosmetically change, it can be a real timesaver for troubleshooting.

Thursday, May 14, 2009

Blog posting for new Service Level Dashboard solution is coming

It took me a while to get the new Service Level Dashboard (SLD) – based on SharePoint 3.0 Services and connected with SCOM R2– working.

None of them related to the solution itself but to my experience with SharePoint (not present), and a test environment being a bit problematic.

But after a total rebuild of the test environment (DC, SQL, IIS, RMS, SharePoint) I got the SLD solution Up & Running.

All I have to do now is to build some SLA’s to monitor in OpsMgr and adjust the SharePoint Portal website for the SLD.

As soon as I get results I will post about it.

Wednesday, May 13, 2009

New KB article: SCOM Console may crash after upgrading to R2

Under certain conditions the SCOM Console may crash after upgrading to R2. This issue is related to third party MPs which aren’t compatible with R2.

KB971285 describes how to solve this problem.

Tuesday, May 12, 2009

Rumor or not? Post SP1 Rollup package

I have heard mentioned it before and now I have heard it again: for SCOM SP1 there will probably come a Post SP1 Rollup package.

This package will most certainly contain most post SP1 QFE’s/Hotfixes.

Among those QFE’s also some changes will be added as well. Since I am not sure what those changes exactly are going to be and I do not like to guess all I can say is to wait until more information gets out.

Monday, May 11, 2009

Management Pack Authoring Console - documentation

No. This posting won’t be about the workings of the MP Authoring Console. Why? There are blogs which describe it very well so there is not much for me to add:
  1. Look here for the blog of Daniele Grandini. He approaches SCOM from a programmers point of view and has made some very good postings.

  2. Look here for a blog purely about the MP Authoring Console.

However, this posting will be about the document accompanying the MP Authoring Console.

Why? Well this document tells exactly what a MP is all about. The way it is constructed, how MPs implement models for monitoring. What classes are and their related attributes. What a Service model is and the available relationships. And so on.

So somehow this document is like ‘Everything You Wanted to Know About MPs (But Were Afraid to Ask)’…

A good read for everyone working with SCOM on a daily basis and wants to know more about what makes SCOM tick.

The document for the MP Authoring Console for SCOM SP1 is available for download, to be found here.

Saturday, May 9, 2009

Two new hotfixes for SCOM SP1 available

Microsoft has just released two new hotfixes for SCOM SP1 environments.
  1. KB969130
    This hotfix resolves an issue with MPs which have many event collection rules. The Dell MP is a good example of this kind of MP.

    Due to these event collection rules the Data Warehouse database may grow.

    This MP contains two new MPs to be imported.

  2. KB961363
    This hotfix resolves a well known issue: SCOM may stop monitoring SNMP devices.

    For this Microsoft already released other hotfixes, from which KB957511 was the most recent one. This hotfix also resolves many other issues.

    This hotfix is meant for (R)MS, Gateway Servers and Agents.
Kevin Holman has a very good post about hotfixes for SCOM. Yesterday he revised this posting. Look here.

Friday, May 8, 2009

Health Service Heartbeat Failure Alerts when monitoring SCCM servers

In environments where a SCCM infrastructure is in place and the SCCM related servers are monitored by SCOM, on a irregular basis Alerts about Health Service Heartbeat Failure will appear in the SCOM Console. These Alerts will close automatically as well since the related service returns to a running state again within a minute or two.

What happens is that SCCM has a mechanism in place which backups SCCM installation folder of that server. It pauses the SCOM Agent Health Service for a short while (a minute or so).

This event in the OpsMgr eventlog will be shown:

clip_image002

Mostly this service is resumed within a minute, so SCOM will not Alert on it. Sometimes however the backup-process lasts a bit longer and this Alert will be shown in the Console:

clip_image002[4]

Even though the Agent Health service is suspended (Maintenance Mode), an Alert will be raised. This is because the Agent Health Watcher is still running and that one will fire off an Alert:

clip_image004

For more information about Maintenance Mode, check this posting of mine.

'Script or executable failed to run' - Part 4

In reference to an earlier posting about possible issues with the most recent DNS MP, found here, there might be another cause and - more important - a solution for it.

Run from the command-prompt on the server experiencing these issues these commands:

Command 1: CD %windir%\system32\wbem
Command 2: mofcomp dnsprov.mof

Restart afterwards the related services:
- DNS
- WMI
- Operations Manager Health Service

A customer of mine came with this solution and until now all looks well.

Scoping Notifications, Alerts and Views

Suppose one has a group of certain servers which run processes/services for which two different IT departments are responsible. These IT departments do not want to see the Alerts of the other department, nor do they want to get notifications of each other. Yet, they monitor the same servers...

Also they do not want Alerts related to hardware or system outages. To make it a bit more complicated, since they are in a migrationprocess, these requirements will change in the near future and will be mixed as well.

Also they monitor processes/services on these servers for which no ready made MPs are available. So for each of these aspects new rules/monitors have to be built.

How to go about it?

How does one scope it in such a way that all these requirements are met AND that it is easily managed within SCOM without building a solution that does the job but is a nightmare to maintain?

A blogposting (section: ‘Using Alert Priority as a notification filter strategy’) of Kevin Holman gave me the direction how to go about it.

First I asked myself the question: Which IT department is going to get the most rules/monitors?

This is a very important question since it will save the customer (and me) a lot off work to be done in the end, applying the needed overrides.

Then I decided what scoping to use. Of course, all the Alerts generated by the rules/monitors (yet to be built) will have the Severity Critical. But for one department the Priority will be set to High (integer 2), for the other department the Priority will be set to Low (integer 0).

Then I looked into the needed rules/monitors and how to make them work. I am a strong believer in the credo KISS: Keep It Simple Stupid. This credo doesn’t come from me but from Kelly Johnson.
The simpler a rule/monitor is, the better it works and the longer it will be used.
For the department which got the most rules/monitors I decided they would get the Priority High and the same way would the rules/monitors be set as well.

With all this information I started to built the needed rules/monitors, Views and Notification Models. Of course, all rules/monitors are disabled by default. All rules/monitors are targeted at the Windows Server 2003 Computer object.

Besides that I built a group containing all the servers to be monitored by these departments.

For one department I scoped the View to show only the Alerts <> 255 Resolution State, Priority High scoped to the new group. The other department got a new View with <> 255 Resolution State, Priority Low also scoped to the same group.

For the Notificationmodel I used the same method. One department would be notified for Critical High Alerts, the other department would receive notifications which are Critical Low Alerts for the new group.

Then I started to ‘fire-up’ the rules/monitors by using overrides. For most overrides I used the newly made group. Depending on the department I changed the Priority setting as needed.

In other situations I made an override based on a single server and changed the Priority level as needed.

Fieldtested it and it works like a charm. The Views, the Alerts and Notifications do not only get filled/out properly, but also to the destination where they are supposed to go to.

And the third department (Hardware) get’s a notification when these servers go down since they have a Notificationmodel scoped on Agent Health Service and Health Service Watcher for these servers.

Phew!

And yes, everything has been neatly documented.

Thursday, May 7, 2009

New kid in town: Ops Logix and a free cool gift: the Ping MP.

A simple pingtest with SCOM and being properly alerted when something is down, is not easily done. Yes, solutions are to be found on the internet but none of them was really a good solution. More like workarounds they were. But those days are over...

A new company which builds native Management Packs for SCOM has presented itself on MMS 2009 in Vegas. Eventhough I couldn't attend to MMS, I found a mailmessage in my mailbox about it's launch.

The same mailmessage talked about a FREE MP, the Ping Management Pack, to be found here. One only has to provide his/her name and mailaddress and soon one will receive a mailmessage containing the download link.

Today I put this MP into usage (in a SCOM testenvironment that is) and I must say it works like a charm. Not only that, it is easy to import, confgure and overall in its usage. On top of that the Alerts are good to understand and they auto-resolve themselves.

Another advantage is that bulk-import is supported as well. So when one wants to add many devices at once this can be done. I should have had this free MP months ago at another customer. There I had to add a couple of hundred networkdevices by hand, one by one at a time.

This MP really fills up a gap left by SCOM.

The site of Ops Logix talks about intelligent MPs. Well, if the other MPs they deliver are of the same level as the free Ping MP, this is certainly a company to remember.

Wednesday, May 6, 2009

Error: IIS Discovery Probe Module Failed Execution - IISDiscoveryProbe Error: 0x80090006

At a customerssite this error popped up in the SCOM Console: IIS Discovery Probe Module Failed Execution.

When looking at the error description this information was given: Error initializing IISDiscoveryProbe Error: 0x80090006 Details: Invalid Signature.

When I googled for this errormessage I soon found this KB article from Microsoft. Eventhough it talks about connecting to SQL-server the errormessage is the same.

The server experiencing this error is Windows 2000 Server based and had IE 5.x running. After 'upgrading' it to IE 6.x the errors were gone and all is well again.

The discoveryprobe is running like clockwork now on this server.

Service Level Dashboard 2.0 MP for SCOM R2 and SQL Embedded

Yesterday late I was building a testenvironment with SCOM R2 for testing the new Service Level Dashboard 2.0 MP for SCOM R2.

I bumped into a installation error of the msi-file (a wizard actually) needed for this MP, see screendump:


Whatever I tried and information I supplied into this wizard, the same error kept popping up.

So I dropped the Microsoft team responsible for this MP a mailmessage asking what I was doing wrong...

Raghu Kethineni from Microsoft responded very fast, so I learned what I was doing wrong.

Being a SCOM geek but NOT a SharePoint geek (more a SharePoint Newbie), I had installed SharePoint 3.0 on a testserver, using the most simple mode. But then SQL Embedded is being used and not the full blown SQL server edition.

And with SQL Embedded this MP won't work. So a good lesson learned: when customers do not run a SharePoint Farm with a full blown SQL-server in the background, this MP will not work.

And for me as well, since the manual talks about SQL-server and NOT about SQL Embedded. So for me it is as well Read The Friendly Manual...

However, I hope to post soon about this MP and my findings.