Thursday, September 29, 2011

VMware View MP Issue II: DA Health doesn’t rollup to top level entity

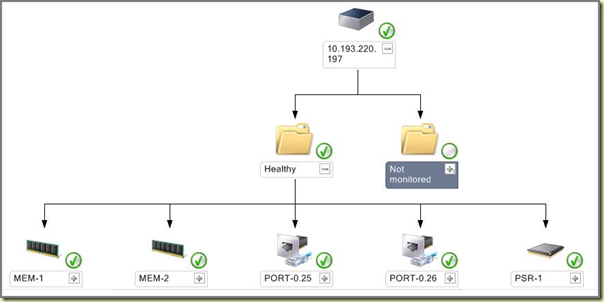
Bumped into this issue. The VMware View MP was in place and functional. The Discoveries ran like clockwork: Objects and their related statuses were coming in. Also the Diagram View was getting its related Objects. Nice!

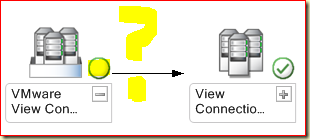
But after a few hours the top level entity of the DA still showed no status:
image

Cause
So time for a small investigation. First I ran Health Explorer against that Object. And with a single glance I knew why this Object didn’t get a status:
image
Exactly! Not a single Monitor is in place. Only the Parent Monitors, which are by default shown for any Object, but nothing else. So no matter what, but that Object will never ever get any status. Which is bad. Personally I don’t like DAs which have any component which are stateless.

Workaround
However, the second DA Component (View Connection Server Group (xxxxxx)) does have a status:
clip_image002

So why not borrow it by using a Dependency Rollup Monitor? The funny thing is with Monitors like these, they borrow/reflect the status of any other Monitor. So by themselves these Monitors aren’t monitoring anything. They just copy the status of any other Monitor.

How it was built
In the SCOM R2 Console: go to Authoring > Authoring > Management Pack Objects > Monitors. Hit the Change Scope option in the top level bar and select as Object VMware View Connection Server Groups > OK. Now the Object is shown. Collapse it by clicking on the plus signs and you have a view like this: 
image

Right click on Parent Monitor Availability > Create a Monitor > Dependency Rollup Monitor. And follow these screen dumps:
clip_image002[4]

Select as Monitor Target VMware View Connection Server Groups , as Parent Monitor Availability and empty the checkbox for the option Monitor is enabledNext

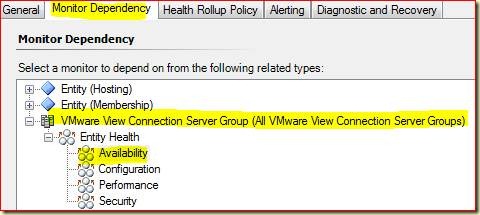
For Monitor Dependency select the sub node Availability under the node VMware View Connection Server Group (All VMware View Connection Server Groups) > Next
clip_image004

For Health Rollup Policy nothing needs to be changed > Next
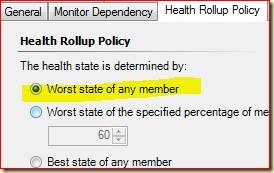
clip_image006

For Alertingnothing needs to be changed (we don’t want too many Alerts, only a Health State) > Create
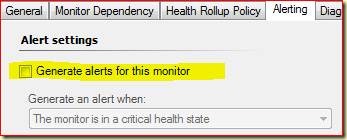
clip_image008

When the Monitor is created, create an Override For all objects of Class: VMware View Connection Server Groups by setting Enabled  on True and save the Override.
clip_image010

Now the top level DA component does have a valid Monitor and soon the DA will show the Health Status:
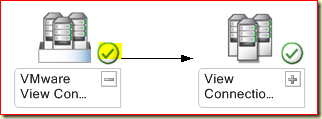
image

Wednesday, September 28, 2011

VMware View MP issue: VMware View version 4.6 not recognized by older version of MP

Bumped into this issue on a customers location.

They have many different VMware solutions in place. Much of them is being monitored by SCOM, using the nWorks Veeam MP. Some weeks ago the customer introduced a new item to the VMware mix: VMware View.

Nice but not working…
This product is shipped with a Management Pack for SCOM. How nice! However, the MP (version 4.6.0.4914) didn’t land. No matter what we tried.

Failing Discovery Script
As it turned out, the primary Discovery script failed. The version of VMware View the customer has in place is 4.6 and this version isn’t properly discovered.

Is there a newer version?
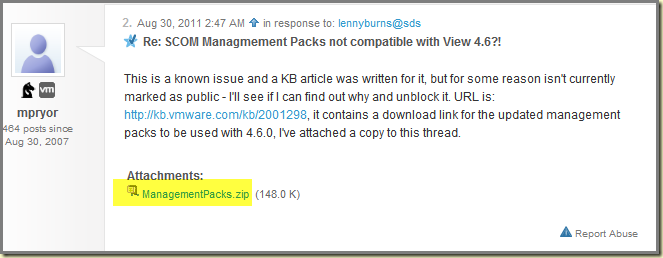
Time to look for another MP. Soon we found it here. The mentioned KB article is still locked, but the moderator attached the related MPs in his comment. The version of this MP is 5.0.0.5311 and works great with VMware View 4.6.
image

So whenever you have VMware View running at a version higher than 4.5, you need the latest MP (at the moment this posting was written version 5.0.0.5311) which can be found here. This MP can be imported while the older version is in place. They will be nicely overwritten.

The requirements for this MP are:

  • Presence of the SCOM Core MP;
  • Presence of the Base Server OS MP;
  • Agent Proxy enabled on the Windows Servers which host VMware View Connectivity roles.

Not a requirement, but nice to have:

  • The View Connection Server Group needs a proper name. In the SCOM Console it looks better compared to an empty string. The guide related to the MP describes how to achieve that.

Monday, September 26, 2011

Intelligent Service Monitoring – Part II: By Example

----------------------------------------------------------------------------------
Postings in the same series:
Part I – The Deal
----------------------------------------------------------------------------------

In the second and last posting in this series I will demonstrate how to monitor Windows Services configured in active/passive mode as stated in the first posting of this series. When you haven’t read it, please go back and read it since otherwise you won’t fully understand this posting.

The Example
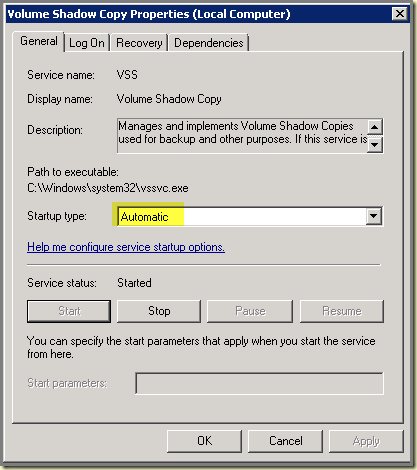
In this example I have taken a Windows Service which is present on two of my sandbox servers: Volume Shadow Copy. On server SV01 this service is set to start automatically and running:
image

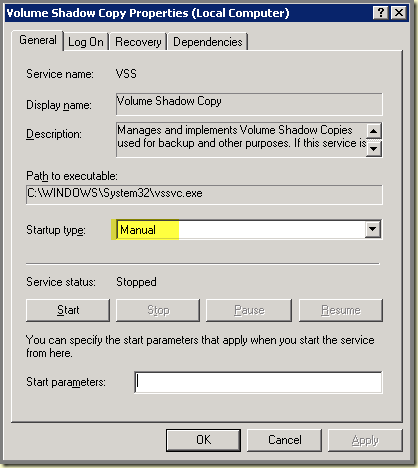
On server SV02 this service is set to start manually and in a stopped state:
image

In this example these Windows Services are configured in Active/Passive mode: when the Windows Service on server SV01 stops, the underlying application will start the same Windows Service on server SV02.

So these Windows Services relate to each other and must be monitored as such. SCOM mustn’t raise an Alert when ONE Windows Service on both servers isn’t running because that is as it should be. When both Windows Services don’t run however, an Alert must be raised. Also, when the Windows Service isn’t running on one of both servers, the Health mustn’t be critical.

Lets build

  1. Create a Group
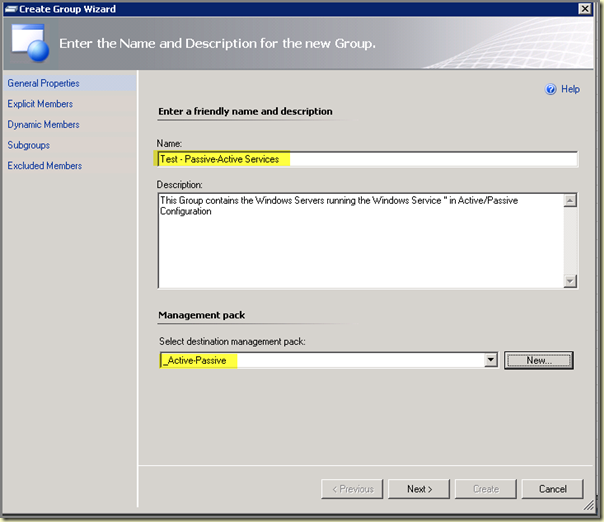
    First we need to create a Group containing both Windows Servers. This Group will be used for targeting the Monitors. Since we will put this Group into an unsealed MP and the Monitor as well, we need to put both of them in the same unsealed MP. Why? Unsealed MPs can only reference sealed MPs, not other unsealed MPs.

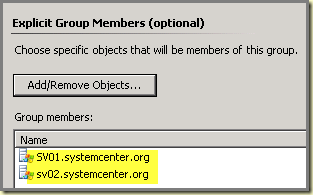
    Go to Authoring > Authoring > Actions > Create a new Group. Here I have populated the Group explicitly with the Windows Computer objects (in bigger environments its better to populate the Group dynamically):
    image
    image

  2. Run the Windows Service Wizard
    Now it’s time to use the Windows Service wizard, located here: Authoring > Authoring > Management Pack Templates > Windows Service. Right click it and select Add Monitoring Wizard > Windows Service > Next.

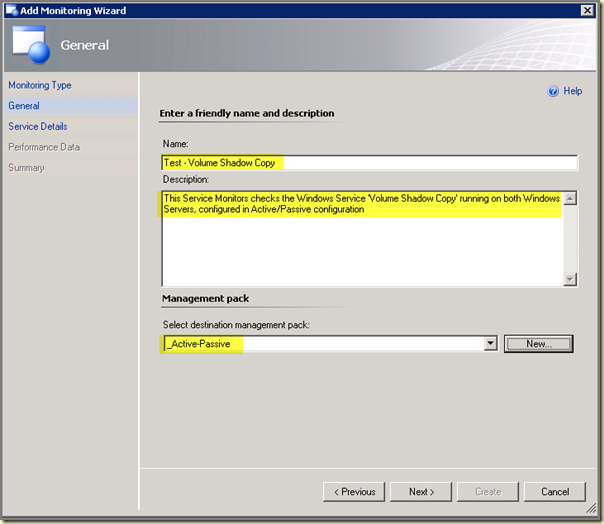
    Give the Monitor a proper Name so these Monitors can be differentiated easily from the others.
    image

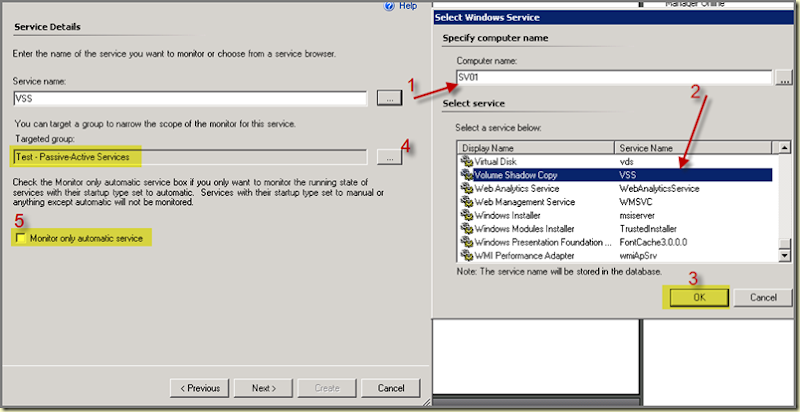
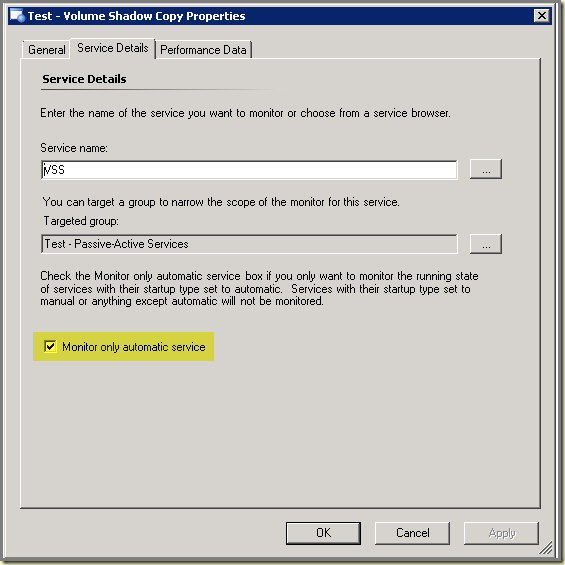
    Next > click on the radio button (1) for Service Name and select one of the related servers > select the proper Windows Service (2) > OK (3) > back in the screen select the proper Group under Targeted Group by clicking the radio button (4) > back in the screen deselect the option Monitor only automatic service (5) > Next.
    image

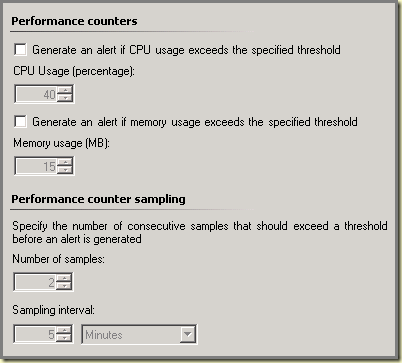
    In this example we don’t want to collect any performance data, so leave this screen untouched
    image
    Next > a summary is shown.
    image
    Check it, when all is well > Create.

  3. Let’s change some stuff…
    Now the Monitors are created. Also the related Discoveries and Rules. The latter ones will be disabled since we don’t collect any performance data in this example. But the Monitors are in place and will become functional.

    But the behavior won’t be good for these kind of Windows Services configured in Active/Passive Mode.

    First we don’t want an Alert.
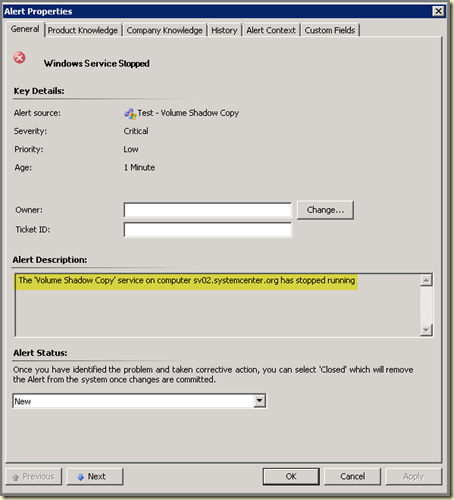
    image
    Like this one. Time to get rid of it…

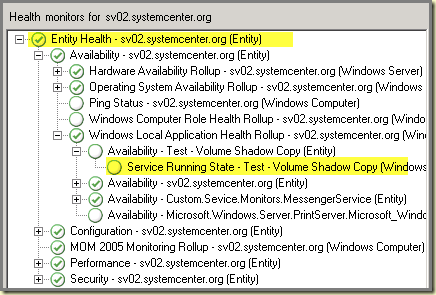
    Secondly we don’t want the health state affected negatively when only one Windows Service isn’t running, since that is how it should be in a Healthy state:
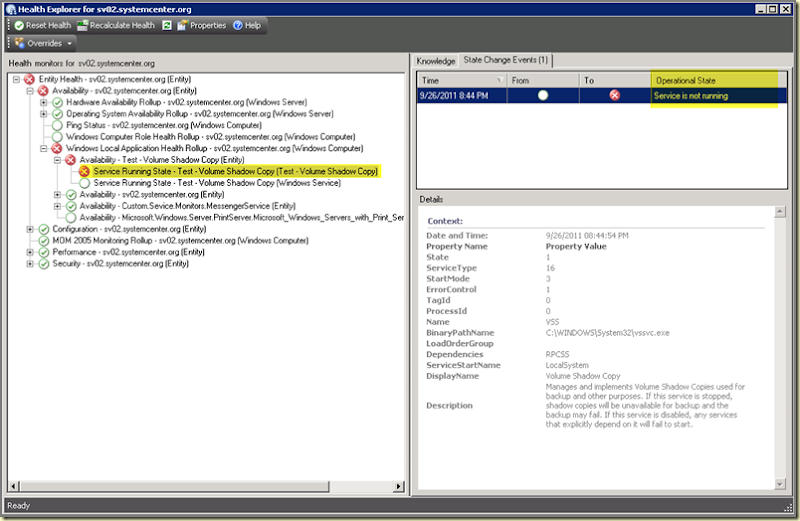
    image
    Duh! That’s as it should be. So this situation is Healthy. How to make this happen in SCOM R2?

    So let’s start modifying SCOM R2 in order to make it work as we want it. Go to Authoring > Authoring > Management Pack Objects > Monitors and scope the View to Test – Volume Shadow Copy. Now the View will look like this when you expand Parent Monitor Availability:
    image
    Now here is a tricky part: there are TWO service Monitors: both are enabled by default but one is also DISABLED through an override. All done by the Wizard. Rule of thumb in order to select the proper Monitor (the one which isn’t disabled through an override) is looking at the MP: the correct Monitor which requires adjustment must reside in the MP you created yourself. So in this case I select the second Monitor by double clicking on it.

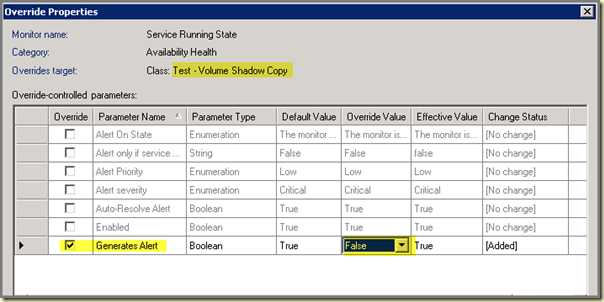
    First we don’t want an Alert any more. Later on we will modify SCOM in such a way that only an Alert will be raised when BOTH Windows Services fail. Disabling an Alert can be done in two ways: by deselecting the option Generates an Alert for this Monitor, found under the tab Alerting. Another approach is to set it through an override. I myself prefer the latter option since it doesn’t change the original configuration in any kind of way, so there is always a way back.
    image

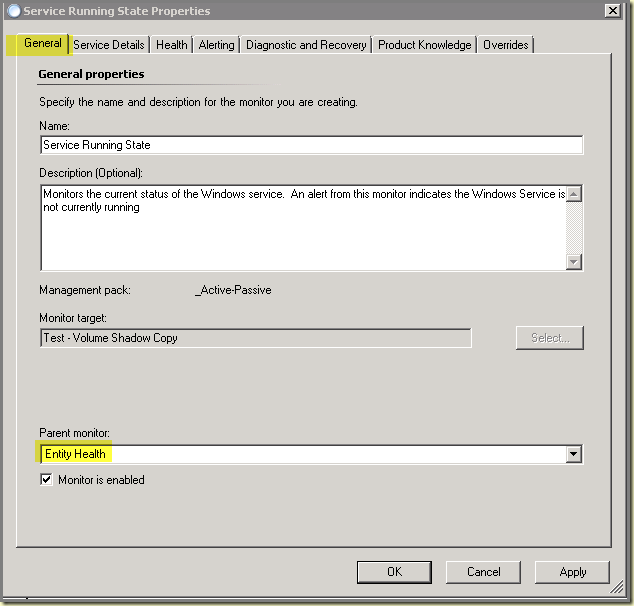
    Save the override > Apply > OK. So now this Monitor won’t raise an Alert any more. Time for step two. Now we don’t want to the Monitor to roll up to the Entity Health State. Stay in the properties screen of this Monitor and go to the tab General.
    image
    Change the Parent Monitor from Availability to Entity Health > Apply > OK.

    As you can see, the Monitor is moved from Parent Monitor Availability to Entity Health:
    image

    Let’s check the Health Explorer for SV02 which was in a Critical condition first:
    image
    As you can see the related Windows Computer is Healthy now since the Windows Service Monitor isn’t shown any more. Don’t let the other Monitor fool you since that’s the one which is disabled through an override by the Service Monitoring Wizard.

    So we’re getting close now: A Windows Service is being Monitored, no Alert is raised when the service doesn’t run AND the Health State isn’t affected as well. Almost feels like creating something and then killing it, doesn’t it?

    But… how to bring in some intelligence? We want to monitor these Windows Services in an active/passive configuration and get an Alert when BOTH Windows Services don’t function anymore. This is where the Distributed Application comes in.

    BEFORE WE CONTINUE: BUG ALERT!
    I have noticed this behavior in SCOM R2 CU#5: When the Parent Monitor is changed, the Windows Service Monitor is set back to check only automatic Windows Services:
    image
    Whoops! We REMOVED that, didn’t we? And now when we remove it again, the Parent Monitor will be changed back to Availability. So don’t change it. Instead, create an override against the same monitor for which we changed the Alerting to none and changed the Parent Monitor. Now create an override for the Parameter Name Alert only if service startup type is automatic by typing (yeah, now typo here…) false in the column Override Value > Apply > OK.
     
    image
    Now the bug is elevated… 


  4. Let’s add some brains
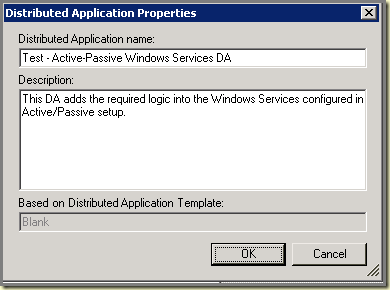
    Go to Authoring > Authoring > Distributed Applications > Actions > Create a new Distributed Application. Remember to put the DA into the same unsealed MP and select the blank template.
    image

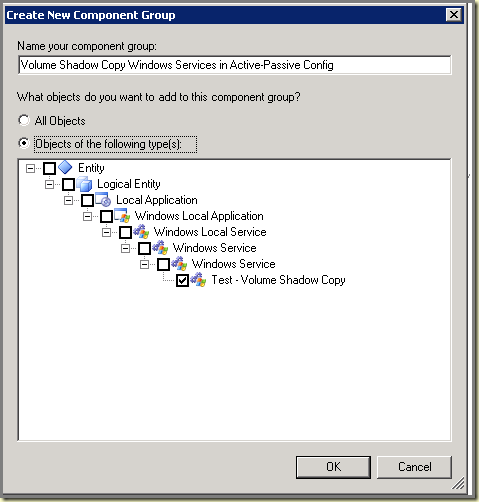
    In DAD, search for both Windows Services > when found select them both > right click > Add to > New Component Group and give this DA Component a good name like Volume Shadow Copy Windows Services in Active-Passive Config:
    image
    OK > now you have this DA component:
    image

    Add other DA components if required. In this example I don’t add additional components. In real life however, sometimes I end up with DAs containing over 30 components. But that’s another story :)

    > Save. The MP is saved now and the related Monitors and Objects in SCOM created. Close DAD.

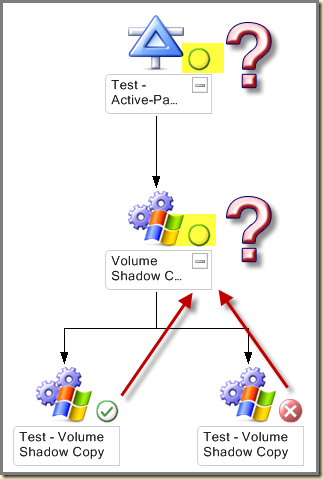
    Let’s change the default behavior now. This part will add the brains and make the DA work. Because when you open the DA in Diagram View this is what you’ll see, Health isn’t rolling up to the DA:
    image
    But that’s because we changed the Parent Monitor for those Windows Service Monitors from Parent Monitor Availability to Entity Health remember? So the Monitor related to the DA Component Volume Shadow Copy Windows Services in Active-Passive Config has to be changed as well…

    Go to Authoring > Authoring > Management Pack Objects > Monitors and scope the View to Volume Shadow Copy Windows Services in Active-Passive Config. Now the View will look like this when you expand Parent Monitor Availability:
    image

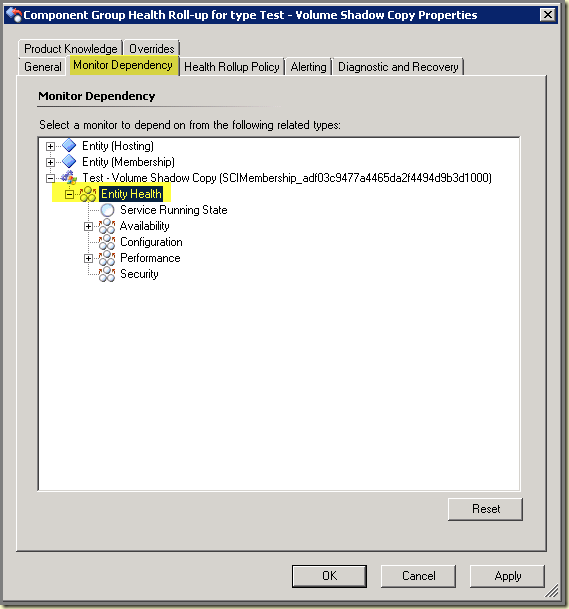
    Double click on Monitor Component Group Health Roll-up for type Test – Volume Shadow Copy. The properties screen for this Monitor will opened now. Go to the tab Monitor Dependency and select the Parent Monitor Entity Health > Apply.
    image

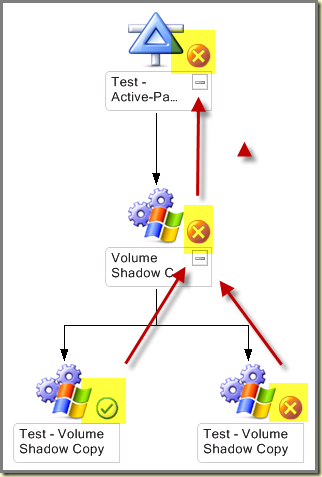
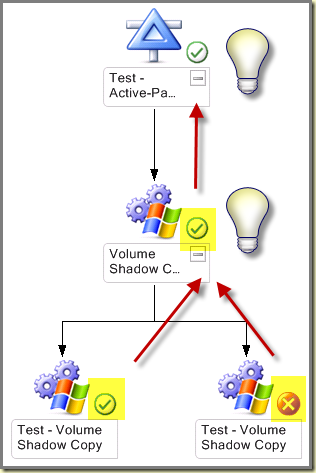
    Let’s check the Diagram View again: Aha! Health is rolling up. Only not good since ONE Windows Service is running and one isn’t. So still we’re lacking the required intelligence:
    image

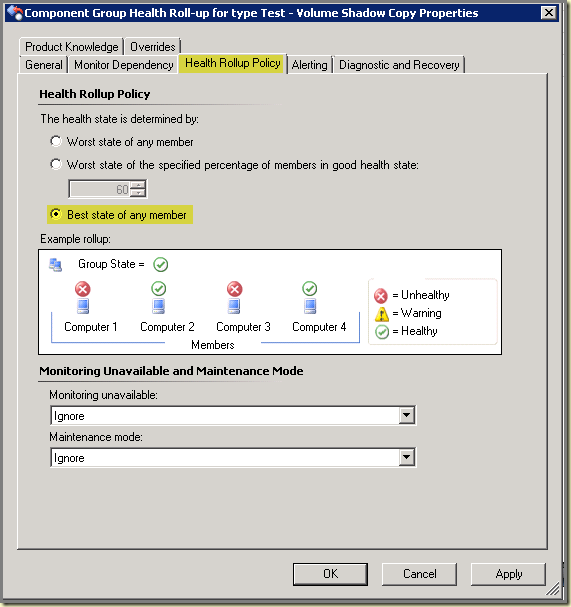
    So let’s go back to the properties screen of the Monitor related to the DA component (Component Group Health Roll-up for type Test – Volume Shadow Copy) and add some more changes as well. Now we go to the tab Health Rollup Policy and change it from Worst state of any member to Best state of any member > Apply:
    image

    Let’s check the Diagram View again (it might take some minutes, so be patient):
    image
    Tada!!!! So FINALLY some intelligence is coming in! Nice!

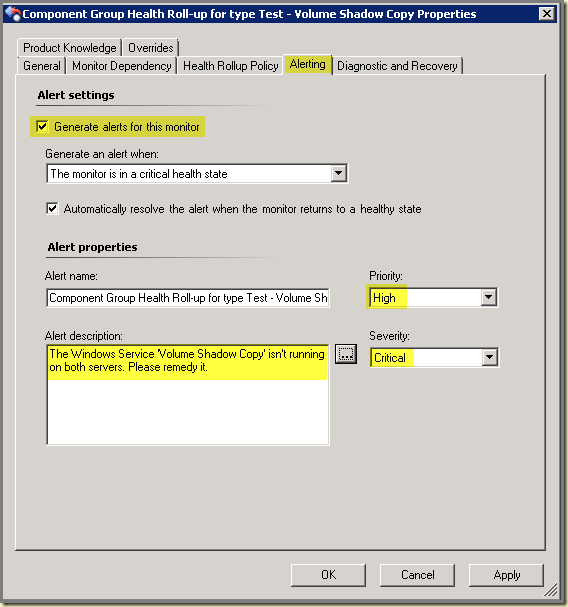
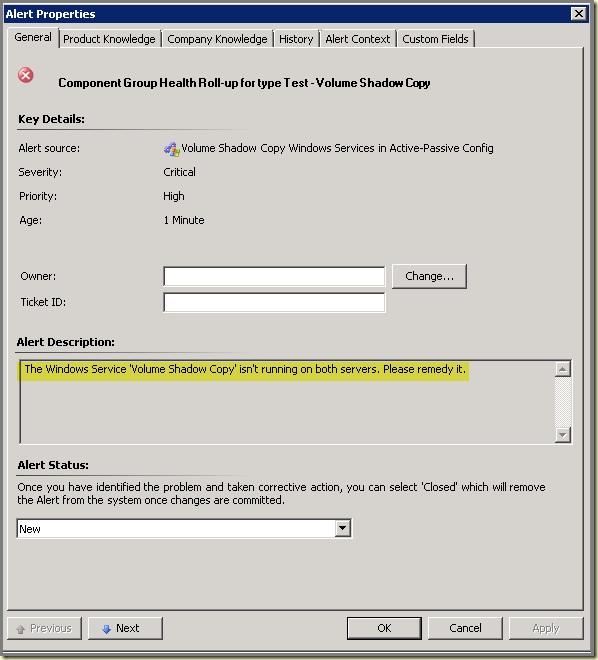
    Now we want an Alert to be raised when BOTH Windows Services stop functioning. Normally the Monitor targeted against any DA Component, don’t raise an Alert. So let’s change that as well. Go back to the properties screen of the related Monitor (Component Group Health Roll-up for type Test – Volume Shadow Copy).

    Go to the tab Alerting and select the option Generate alerts for this Monitor. Add a proper Alert Description (you can choose to add some parameters as well) and change the Priority and Severity as required.
    image 
    > Apply > OK.

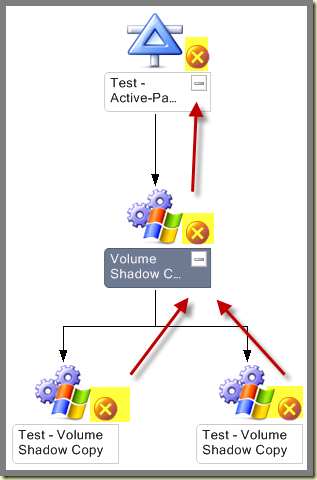
So now all is in place and the intelligence is added. Let’s test it and stop the service on server SV01:
image

And the Diagram View:
image 

Nice! All is working as intended! Really sweet it is.

Conclusion
SCOM can add intelligence to Service Monitoring, even though it might seem overwhelming. As a matter of a fact, it isn’t since the approach as described in this posting is ALWAYS the same. So familiarize yourself with it and before you know it you create intelligent Monitors like these in the matter of minutes! Happy SCOMming!

Custom Reports: Using Groups in drop-down list

When creating custom Reports it’s always nice to have a parameter area where one can enter things like a Start- / End Date. Many times the Report needs to be targeted against a Group as well.

And creating a Dataset for a parameter like that can be a challenge. Jonathan Almquist has posted an article about this particular dataset, which is great. Thanks Jonathan for sharing!

Want to know more? Go here.

Wednesday, September 21, 2011

New KB Article: Troubleshooting gray SCOM Agent states

Even though this article looks almost the same as this posting, it isn’t :).

Yesterday Microsoft published a KB2288515, all about troubleshooting gray SCOM Agents. It contains tons of good information, starting from easy troubleshooting to taking a deep dive into your SCOM environment.

This posting must be the combined effort of CSS and the PFEs I guess. So whenever you have some troubled Agents go here and read.

OM12: Network device monitoring

Yesterday the OM12 team posted an article all about network device monitoring in OM12.
image

This posting answers these questions:

  • What is discovered on the network device?
  • Is monitoring available out of the box for component discovered?
  • Is monitoring is enabled out of the box for component discovered?

Posting to be found here.

Monday, September 19, 2011

Management Packs: Shiny and Rusty Obsolete Cars

Before I start, I want you to know I thought this posting over and over. Like: ‘Should I post it or not?’ At the end I have decided to do so since I want my blog to be open and honest.

But also I want my blog NOT to be the place for flaming nor bashing. So this posting isn’t about attacking any one in any kind of way. I just want to share my thoughts about a component which is key to any SCOM/OM12 environment: The Management Pack. It brings the intelligence to your SCOM/OM12 environment.

The Road and the CAR…
Since no matter how fancy SCOM/OM12 is, it’s the infrastructure for your Monitoring Solution. It monitors itself. But you didn’t install SCOM/OM12 for that. You want to know how your hardware is doing, What about the server OS? Virtual Infrastructure? DNS? AD? DHCP? WINS? Exchange? The print servers?

This is where the Management Packs (MPs) come into play. The MPs are the components which enable SCOM/OM12 to monitor your ICT environment down to the nitty gritty details. For every service/application/functionality you want to monitor, you need a MP. So the SCOM/OM12 infra is like the roads and the MPs are like the cars which are customized in order to serve special purposes.

Let’s stay a while longer at this comparison. No matter how good the roads are, when you drive an old car with a broken suspension, the ride will be bad. But when you drive a new car with good suspension, you’ll have a good ride. Even when the roads aren’t that well maintained.

Same goes for MPs. They can make or break the total experience of your SCOM environment. No matter how good the SCOM/OM12 infra is. So to my opinion, the MPs must be top notch. So whenever there is a glitch in the SCOM/OM12 environment, the MPs will take care of it.

How about the MPs?
There are good things to be told to downright bad things and everything in between. Some MPs are like really shiny cars with all the polishing and extra’s, some of them are not totally OK but will still fit the bill and a few of them are just rusty, obsolete cars which must be scrapped.

As far as I am concerned, this is my personal list of them, all coming out of the car factory Microsoft:

  • Shiny Cars
    Like: Wow! I want MORE of them. Like driving a Ferrari or Rolls Royce. Everything is just perfect. Nothing needs to be done.

    - Core MP for SCOM R2
    - Exchange 2007 MP
    - Server OS MP

    - SQL

  • Budget Cars
    Like: I want to go from A to B for an economical price and reasonably safe and in comfort as well. Some polishing is needed. But the car itself feels right.

    - AD
    - DNS
    - SharePoint
    - Active Directory
    - IIS
    - Lync


  • Questionable Cars
    Like: Oops! Thought I bought a reasonable occasion but it doesn’t feel right. Should have spent a few more dollars. On the way back home I have to buy some tools and car parts…
    image 

    - ForeFront
    - DFS
    - Exchange Server 2003
    - SCCM
    - OCS 2007 R2

  • Rusty Obsolete Cars
    Like: Now I know why I only paid 10 dollars for it! Oops! Was that my left front wheel falling of? The brakes don’t react at all. Hopefully my insurance will cover the expenses…

    - WINS
    - Exchange 2010
    - DHCP
    - Print Server

Hopefully the cars coming out in the near future will become better and the last two categories (Rusty Obsolete Cars & Questionable Cars) will be gone for good. That way the total driving experience will only become better.

Wonder what you think about it. Happy driving all!

Sunday, September 18, 2011

Intelligent Service Monitoring – Part I: The Deal

----------------------------------------------------------------------------------
Postings in the same series:
Part II – By Example
----------------------------------------------------------------------------------

In this series of postings – two parts as I see it now – I will cover in detail how to go about creating Service Monitors in the regular SCOM Console. The first posting will cover the whole theory behind it and the second posting will contain a step-by-step guide how to go about it. Let’s start.

Now hold your breath since I know what you’re about to say: ‘Duh! Creating a Service Monitor is a straight forward process, so why write TWO postings about a topic that simple?’.

True when monitoring one or more Windows Services which don’t have any relationship with each other. But the whole story changes when you want to monitor one or more Windows Services which run on multiple servers (two for instance) in an active/passive configuration. Now it becomes a total different kind of ballgame since you REQUIRE certain intelligence in those Service Monitors. But how to achieve that? Almost sounds like the Gordian Knot.

Situation
Suppose you run two servers. Those servers run the same application, one in passive mode (related Windows Service isn’t running) the other in active mode (related Windows Service is running) . But these servers aren’t HA clusters as Microsoft knows them. So the Cluster MP won’t look at them as cluster nodes. And yet they are for this particular application.

I want to monitor…
Now you want to monitor the Windows Services related to that application running on both servers and have them displayed in a Dashboard. These services are set to run manually and are administered by the application. When one server dies, the other server takes over and the services are started by the application itself.

Challenges
When one wants to monitor Windows Services configured like these, there are some bumps in the road because:

  1. One server out of those two servers doesn’t run the related Windows Service by design so that Monitor will enter a critical state which rolls up to the health of the top level entity of that server. Now the server has a Critical state while all is well for that server.

  2. An Alert is raised. Which is good under other circumstances but not now. Since one Windows Service isn’t supposed to run at all by design, so

Workarounds
Both issues can be dealt with:

  1. The Parent Monitor for that particular Service Monitor is modified from Availability to Entity. Now the Monitor will still have a critical state but the health won’t rollup any more to the top level entity of that server so that server stays green Glimlach.

  2. The Alert for this Monitor is disabled (either directly by editing the related Monitor or through an override. I myself prefer the latter).

OK, we’re almost there now but still some issues to reckon with
But now another issue arises. 

  1. You need to group BOTH monitors targeted against the same Windows Service as well since they relate to each other. One Windows Service is running (green) and the other isn’t (red). By design the health state for that group is calculated by the worst state of any member. Which results in a Critical State. This can be easily adjusted so the health state is calculated by the best state of any member. Now the Monitor has a healthy state and will enter a critical condition when BOTH Windows Services aren’t running. So far so good.

  2. But suppose you use a DA for this. And put those two Windows Services into a single DA Component (which groups those two Windows Services together, thus expressing their relationship). This DA Component is by default targeted against the Availability parent monitor. But the Monitors related to those two Windows Services are moved to Entity (remember?). So health won’t rollup for that Monitor which results in a DA Component in an unmonitored state.

    In order to obtain a Health state for that DA component, the Monitor Dependency, for the Monitor targeted against that DA Component has to be changed as well, from Availability to Entity Health. And now the DA Component gets into a monitored state WITH all the required intelligence as well.

  3. Now we also want an Alert when both Windows Services aren’t running. By design a DA Component doesn’t raise an Alert. So the Monitor targeted against the DA component must be changed as well in order to raise an Alert.

Does it work as intended?
Yes, it does! Now everything is in place and SCOM is properly monitoring Windows Services which are configured in passive/active configuration. The services are monitored on a per server basis, one is green the other red but no Alert is raised nor is the Health of that server impacted by it. Also BOTH services are being monitored and alerted upon when BOTH Windows Services don’t run anymore.

Hopefully I haven’t lost you half of the way! In the next posting of this series I will show you how to go about it by using an example. See you all next time.

Friday, September 16, 2011

How To: Monitoring Websites and the choice of methods

Tim McFadden doesn’t post on a regular basis, but when he posts, it’s always a good read.

Apparently he has been busy last day since he posted in total FOUR postings all about monitoring websites. His postings contain good solid information how to achieve that in SCOM R2.

So when you want to more about:

  1. The custom URL MP by Russ Slaten;

  2. How to operate the Bulk URL Editor;

  3. How to operate the Web Application MP Template;

  4. Three ways to monitor websites with SCOM.

Just click on the links and have a good read. Thanks Tim for sharing!

Thursday, September 15, 2011

New KB Article: Agent Health Tips and Fixes for SCOM

Yesterday Microsoft posted an updated KB article all about SCOM Agent Health Tips & Fixes.

As we all know the SCOM Agent plays an important role in any SCOM environment. So it’s important to run healthy Agents. Whenever there are issues check KB2616936. It will tell you a lot about what to do when certain issues arise. Also some important hotfixes (for WMI, Jet EDB, Windows Scripting Host and so on) are mentioned and referred to.

CU#5 Issue: Patched Agents still show CU#4 patches as well

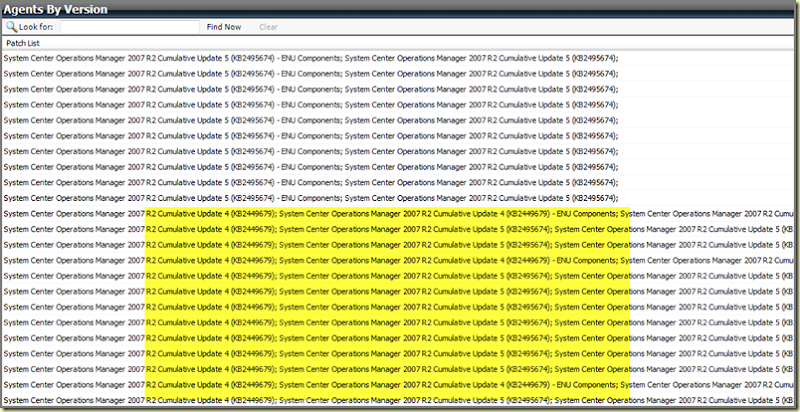
Bumped into this situation: CU#5 was successfully installed on all SCOM related servers. The CU#5 patches were also deployed to the SCOM R2 Agents.

But many of the Agents in the View Monitoring > Operations Manager > Agent > Agents by Version still showed CU#4 alongside CU#5 as well. Even after a few days. So in that timeframe the Discovery Discover the list of patches installed on Agents must have run multiple times since it runs once per six hours. And this Discovery normally pipes the correct CU# level to SCOM.
image

Have seen similar behavior in CU#3 and CU#4. But was hoping to see it fixed in CU#5. Sadly, it isn’t. Even though I must add this is the first time I have seen this behavior with CU#5. Deployed it about six times already.

Time for some investigation and action. First I checked the Agent staging folders on all MS servers. And indeed, the contain the correct msp files, related to the CU#5 update for the Agents.

Secondly I checked the ‘problematic’ Agents. They all run the updated versions (6.1.7221.81)of the files contained within the msp files, 22 in total. Compared it twice with Agents which reported their versions correctly and couldn’t find anything different.

Now it was time to for some remedy actions.

I tried a restart of the Agent. But to no avail. The SCOM Agent still listed CU#4 as well, even after a few hours.

I repaired the Agent. To no avail as well. Same results.

Then I stopped the Health Service and renamed the C:\Program Files\System Center Operations Manager 2007\Health Service State folder to C:\Program Files\System Center Operations Manager 2007\Health Service State_OLD and started the Health Service again on one of those ‘problematic’ Agents.

Within 24 hours the correct information was shown. Still I am puzzled since the earlier mentioned Discovery should kick off soon after the Health Service is started. So within an hour the information should have been correct.

Also I am bothered to remove the Health Service State folder since it might contain information which is queued so not present in the OpsMgr DBs at all.

But sometimes choices have to be made…

Tuesday, September 13, 2011

OM12 Supported Configurations

On TechNet a list of Supported Configurations for OM12 can be found.

Even though the last update of that list dates from the 15th of July 2011, my personal guess is that it will be changed sooner or later with OM12 being subject to many changes while it’s in the process of moving from public beta to the next stage. So keep a keen eye on that site.

Also this list isn’t complete, like the total amount of monitored Agents per Management Group, the total amount of monitored network devices per Management Server and per Management Group etc etc.

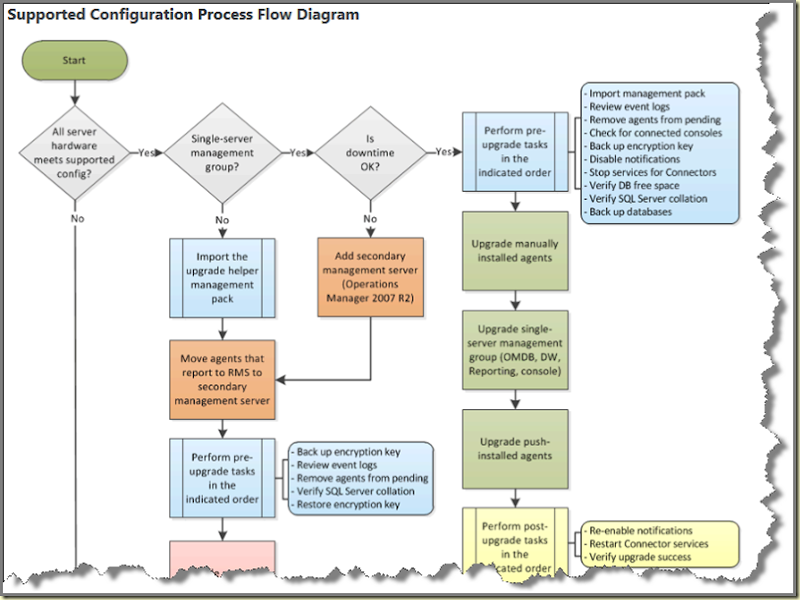
OM 2012 BETA(!) Upgrade Process Flow Diagram

On TechNet an article is published, all about the OM12 BETA(!) Upgrade Process. Since a single picture is worth a thousand words, Microsoft has created an excellent flow diagram about the upgrade process:
image

Please pay attention to this notice on the same webpage:
image

Article to be found here.