Kevin Holman has written a posting about this new DHCP MP containing useful information. My advise is to read it so you’re well informed. And of course, don forget to RTFM the related MP guide as well ![]() .
.
Friday, May 31, 2013
New MP: DHCP MP For Windows Server 2012
Thursday, May 30, 2013
New Whitepaper By Damian Flynn & Savision: Unraveling the Network with SCVMM 2012 SP1
All these characteristics combined makes the whitepapers offered by Savision so unique. Another thing is also good to know: these whitepapers are FREE! All you have to give is your name, company name you work for and a valid e-mail address. They won’t spam you afterwards, believe me. And no, you don’t need to donate some blood or a kidney for that matter ![]() .
.
In the past Savision has joined forces with people like Cameron Fuller and Peter Noorderijk. Those white papers are still available for download from the website of Savision. And yes, I have written a whitepaper as well for Savision, or better for the community.
So now it’s time to introduce the latest whitepaper offered by Savision to the community. This white paper is written by Damian Flynn, MVP and working as an IT infrastructure architect with Lionbridge Technologies based in Ballina, Ireland, specialising in Microsoft Technology.
I met him at MMS and he knows his stuff inside and out! He has also written some AWESOME books all about Hyper-V and the Private Cloud based on Microsoft technologies. Those books have become my personal ‘bible’, simply because they’re just spot on!
The whitepaper Damian has written is titled: Unraveling the Network with SCVMM 2012 SP1.
As Savision states: ‘…In the whitepaper and webinars, Savision and Damian Flynn (MVP) outline the concepts, benefits and steps you need to take to embrace your own “Virtual Network”…’
The whitepaper can be downloaded from here. And – like all other whitepapers offered by Savision – this whitepaper is accompanied with two webinars as well. Here you can ask your questions about the whitepaper and listen to what Damian has to say.
A big word of thanks to Savision who delivers these whitepapers to the community for FREE! Awesome!
Monday, May 27, 2013
Where To Run The OM12 Console From
Of course, during setup this approach isn’t viable at all. But as soon as the OM12 Management Group is functional (that is two OM12 Management Servers are in place and the related SQL databases), there isn’t a good reason anymore to use them to run the OM12 Console from.
Why you ask? Good question. There are multiple reasons:
- The OM12 Console consumes RAM
As the matter of a fact, the OM12 Console might become RAM hungry. Especially when you’re creating new Views, User Roles, Run As Accounts/Profiles, importing/configuring Management Packs and so on. - The OM12 Management Servers require the resources themselves
In any given Management Group, the OM12 Management Servers have a lot of work to perform. More over with the ‘good old’ RMS gone and having distributed the RMS specific workloads among ALL OM12 Management Servers. So why ‘eat’ it away with running the OM12 Console on those servers? And belief me, when YOU start doing it, you’re colleagues are bound to follow soon ((S)He does it as well, so why shouldn’t I?). And before you know it every OM12 Management Server has locally two running OM12 Console sessions running… - The OM12 Console creates PER user a cache file
This cache file might grow overtime to several hundreds of MBs, especially when you have opened all the different Views available in the OM12 Console. This will consume a lot of disk space and create an additional burden. - Let’s talk about security and the lack of auditing…
Now with OM12 the local group BUILTIN\Administrators have SCOM administrator access to the OM12 Management Group. Basically meaning when some one logs on to a OM12 Management Server many times they’re member of that local group, granting them admin access to your OM12 environment. Normally you don’t want situations like these, since the more people can do within any given product without the proper required knowledge, the bigger the changes are something is bound to go wrong. And with an almost lack of any auditing mechanism in OM12 ( ), changes are you’ll never find out who wrecked what in OM12…
Okay! You’ve got me convinced. So now what? Install the OM12 Console on every system the OM12 administrators and end users touch?
No, that’s also a scenario you shouldn’t use. Simply because it becomes hard to manage it when an update for the OM12 Console comes out (on an average basis 4 times per year at least when looking at the release schedule of the Update Roll Up packages).
Instead it’s far more better to use a Windows server dedicated for managing your IT environment. Servers like these run Terminal Servers in user mode, so the server allows more than two concurrent sessions and are called stepping stone servers or management servers (not to be confused with OM12 Management Servers). Servers like these run a plethora of other ICT management applications as well like management tooling for the Virtual Infrastructure, network management tooling, SAN tooling, etc etc.
With a trick the cache file for the OM12 Console is to be redirected to another logical drive, offloading the drive running the server OS. And when an update of the OM12 Console comes out, it’s easily pushed to this server and you’re done. Compared to keep inventory who has the OM12 Console installed, and make sure they all get the proper update, this is a walk in the park.
When this special server is properly provisioned (enough RAM, CPU and disk space) you’ll benefit from it. Even more so when the ICT management applications are used while running a regular end user account (so NOT an account with domain admin permissions!) and the terminal server is fully configured, including the permissions which decide what user account is allowed to run what ICT management applications.
Now you’re in total control of your OM12 environment. Of course, keep the installation files of the OM12 Console on a location which is also protected, preventing rogue installations of it.
Friday, May 24, 2013
Getting Rid Of Nagging EventIDs 7000, 7015 & 7021 When Monitoring Untrusted Windows Servers
It began with EventID 7000: ‘…The Health Service could not log on the RunAs account <DOMAIN>\<SCOM ACTION ACCOUNT> for management group <NAME>. The error is Logon failure: unknown user name or bad password.(1326L). This will prevent the health service from monitoring or performing actions using this RunAs account…’
Soon followed by EventID 7015: ‘…The Health Service cannot verify the future validity of the RunAs account <DOMAIN>\<SCOM ACTION ACCOUNT> for management group <NAME>. The error is Logon failure: unknown user name or bad password.(1326L)…’
But the real killer is EventID 7021 which came last: ‘…The Health Service was unable to validate any user accounts in management group <NAME>…’
And here all monitoring stopped. Simply because the none of the required accounts for the OM12 SP1 Agent couldn’t be validated which broke down monitoring of that related Windows Server as a whole. In SCOM there were two Alerts per server thrown, related to all this:
- Run As Account Could Not Log On
One or more Run As Accounts failed to log on. The account may be disabled or has an expired password. - Unable to Verify Run As Account
The System Center Management Health Service is unable to verify the Run As account.
Since these Alerts kept coming back and the underlying issues couldn’t be solved by the customer, these Monitors were disabled through an override. But that didn’t solve the issue at all…
So it was time for some good old troubleshooting. And guess what? Got it working in the matter of an hour! And believe me, this isn’t rocket science at all. One needs simply to know some basic stuff and how SCOM operates. And when one does, issues like these won’t happen (any more). There is much to tell so let’s start.
The basics
There a two things to know in order to get this solved properly.
01: Meet the SCOM Agent
Typically a SCOM Agent (the Health Service, aka the System Center Management service) runs under the Local System account to get things done. When required, it can spawn multiple MonitoringHost.exe processes under other credentials, as required.
Taken from this posting from my blog: ‘…The HealthService initiates the process MonitoringHost.exe. The HealthService can spawn multiple MonitoringHost.exe processes… as needed. Typically – you will see a couple MonitoringHost processes executing under the Default Agent Action Account. In addition, HealthService will launch MonitoringHost processes under any preconfigured Run-As accounts that are executing workflows on the agents, using those credentials. Thus ‘giving’ the HealthService the credential management capability to support the execution of modules running as different users…’
So this is where the Agent Action account comes in. And – based on best practices – this should be an AD account. But what happens on Windows servers residing outside that very same AD infrastructure, like Windows servers participating in a workgroup for instance?
02: Account distribution
In order to define the proper accounts in OM12 for the corresponding workflows and distribute them to the Windows servers involved, there is an advanced mechanism in place within OM12. It’s based on these pillars:
- Run As Account
Here you can define the proper accounts required to discover/monitor certain classes, workloads. There are many different accounts you can create here: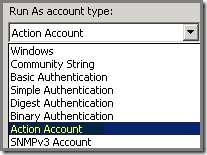
In this particular case we need the Action Account.
- Run As Profile
Here the Run As Accounts can be ‘attached’ to a certain Run As Profile in order to discover/monitor certain workflows. Run As Profiles are to be found in many MPs but you can create your own as well when required. The Default Action Account Run As Profile plays an important role in this posting and is present by default in any MG.
- Distribution
With items 1 and 2 we have the mechanism in place to define the required accounts (Run As Accounts) and to logically group them (Run As Profile). So now we need a mechanism to distribute it to the proper managed computers.
For this distribution there are two types:
- Less Secure.
For lazy admins . Here the Run As Accounts (and their related Run As Profiles) are distributed to ALL managed computers no matter what. Also to computers which aren’t capable to resolve those credentials, like Windows Servers residing in a workgroup for instance. Avoid this distribution type since it introduces many unwanted issues.
 - More Secure.
You need to select manually to which managed computers to which the Run As Account will be distributed. Even though this approach costs more time and planning, it works the best since it only brings the Run As Accounts to the servers they’re intended for.
- Less Secure.
There is much more to tell about this topic. Kevin Holman has written an excellent posting about it, go here.
How the problems were solved
Now with this knowledge we have enough ammo to fight the earlier mentioned problems on the untrusted Windows Servers.
- Goodbye EventID 7021
This one prevented the OM12 SP1 Agent to function at all so it was time to deal with this one first. A new Agent Action account was defined in SCOM, using the credentials of a LOCAL SCOM Action account, freshly created on the untrusted servers. Since it’s a local account this account has to be created on all untrusted Windows servers. Afterwards these accounts have to be created in SCOM as Run As Accounts.
For more information about the permissions the Action Account requires, go here.
How the Run As Accounts were created:- Go to Administration > Run As Configuration > Accounts.
- In this case per untrusted Windows server a new Action account was created, named Action Account <NAME UNTRUSTED SERVER>
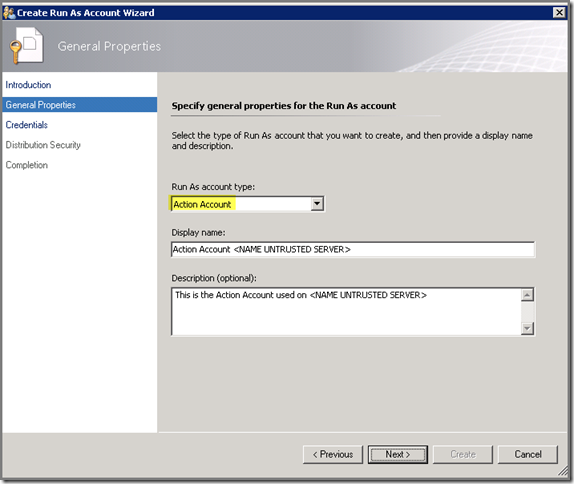
> Next
For the username type <SERVERNAME>\<ACTION ACCOUNT NAME> and the password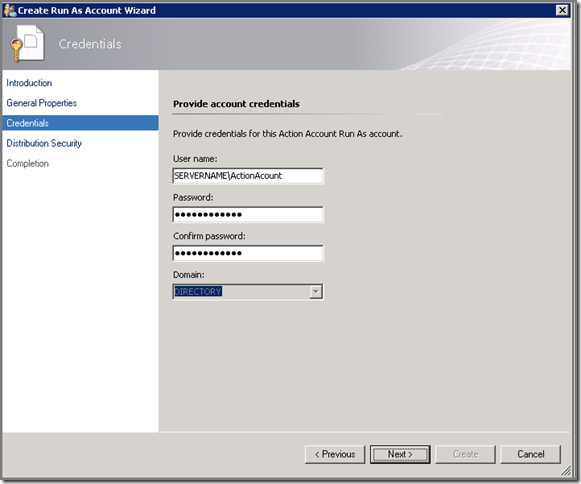
> Next
The More Secure distribution option is automatically selected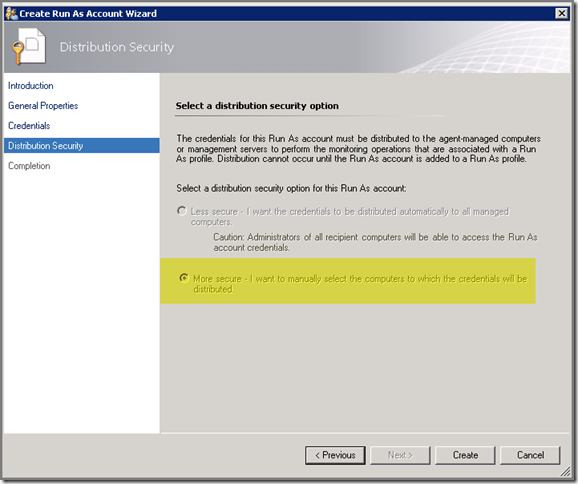
> Create. - Now the Run As Account (Action account) has to be ‘attached’ to the proper managed Windows Server. This is done through the Run As Profile Default Action Account.
- Go to Administration > Run As Configuration > Profiles.
- Open the Default Action Account profile and go to the third option, Run As Accounts.
- Select the untrusted server for which the Action Account in Step 2 is made and modify it accordingly (*).
- Save the modifications.
- Repeat Steps 2 to 7 for all untrusted Windows servers which require monitoring by OM12.
( * : I have seen situations where the related OM12 Agent fell back to the original Agent Action account (Local System). This is easily solved. Start a RDP session to the related server. Open Control Panel > Operations Manager Agent applet > select the Management Group connection involved > Edit > and set the option Agent Action Account to Use the following domain or local account to perform agent actions. Enter the correct credentials. Wait before hitting OK. Adjust the Run As Profile first in the SCOM Console and save it. Now hit the OK button in the Operations Manager Agent applet and you’re just fine.)
After this EventID 7021 was gone and the SCOM Agent started to function normally. Only the nagging EventIDs 7000 and 7015 remained.
- Goodbye EventIDs 7000 and 7015
Still EventID 7000 and EventID 7015 kept coming back, all about the SCOM Agent Action account not being validated. On itself normal since it’s an AD based account but I didn’t understand where this account came from. Not from the Default Action Account profile, that’s for sure.
But some of the Run As Accounts was pushing this account to the untrusted Windows servers, that’s for sure! Time to investigate.- Go to Administration > Run As Configuration > Accounts.
- Look for any Run As Account which uses the SCOM Action account as well and uses the Less Secure distribution method. Also check for the More Secure distribution option where the untrusted Windows servers are defined. Changes are however, that the Less Distribution option is the culprit here.
- Indeed, in this case there was a Run As Account defined which also used the SCOM Action Account and used the Less Secure distribution option.
- Change this to More Secure and select only the servers involved.
- Now EventID 7000 and EventID 7015 on the untrusted Windows servers are gone as well!
As you can see, monitoring untrusted Windows servers can be done without too much effort. But you need to know how certain things work in OM12 and you’ll be just fine. Troubleshooting consumes way more time…
Issue like these happen when not enough time is taken in order to understand the product itself. And many times the product is blamed while that isn’t the true story at all ![]() .
.
Happy SCOMming!
Hey Dude! Where Are My Lync 2010 Edge Servers?
A customer had imported the Lync Server 2010 MP. The Lync topology was neatly discovered, except for the edge servers. Those servers had their OM12 Agent neatly in place and were functioning properly. Everything else present on those servers was neatly discovered and monitored, except for the Lync Edge services…
When I was there I ran through it all and indeed, on the SCOM side of things everything was just fine. And yes, the related guide was properly read. But as it turned out, page 13 was overlooked:
Soon after this was fixed and the Agent on the Lync Edge servers restarted, the Lync Edge servers were neatly discovered and monitored.
So whenever you bump into a similar situation make sure the proper override is in place: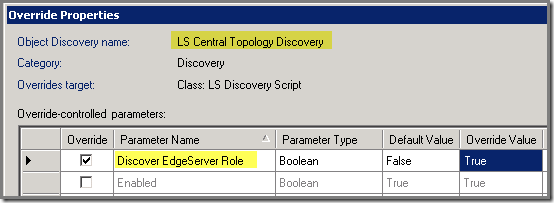
It’s good every MP has a guide. But sometimes crucial information is easily (and unintended) overlooked ![]() .
.
Thursday, May 23, 2013
Free Tool: Jalasoft Xian SNMP Device Simulator v4
I use previous versions this tool already for some years in my SCOM test labs. And it works great but now this tool even got better. Simply because this tool uses agents now for simulating a set of network devices, listed here in the console of this tool: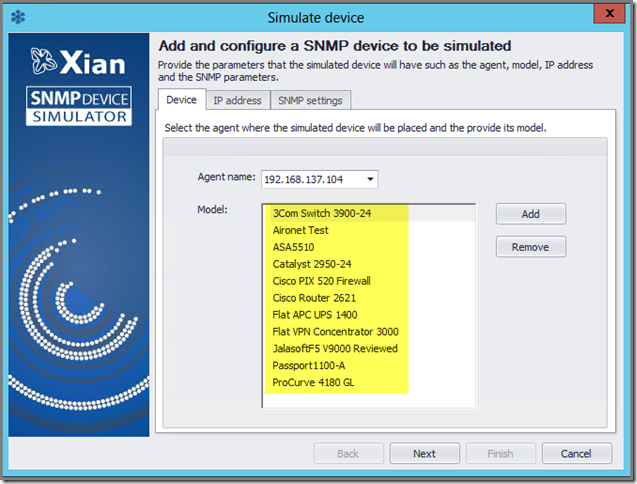
This Agent is easily installed and when running, connected to from the console of Xian SNMP Device Simulator v4. And even though the list of devices to simulate is limited, it enables one to create a whole set of network devices to be monitored by SCOM.
With the old versions, the whole tool had to be installed on every server when you wanted the same kind of setup. Now with the newest version this isn’t needed anymore. Simply install the agent on every server you want, install the console on one server and configure it from there within the matter of minutes.
For SCOM there is a good posting about how to make the best possible usage of this tool, written by Kevin Holman. Even though that posting is based on the older version of this tool, it’s still valid (especially the DNS entries and the associated PTR records).
Posting written by Kevin to be found here and the tool can be downloaded for FREE from here.
Many kudos to Jalasoft for sharing such a wonderful tool for FREE!
Tuesday, May 21, 2013
OM12 SP1: Additional Resolution States: Some Tips & Tricks
As this TechNet article states: ‘…Through Team Foundation Server (TFS) synchronization, you can establish automatic work item routing for alerts that are raised in Operations Manager in System Center 2012 Service Pack 1 (SP1). This can be helpful if your information technology (IT) department uses TFS or if your process model requires that all application alerts must be tracked in TFS…’
So far so good. Until now I bumped into one customer who has TFS in place and joined it with OM12 SP1. And I must say, they like it very much. For them OM12 SP1 with APM and TFS synchronization is THE tool for which there aren’t any competitors to be found.
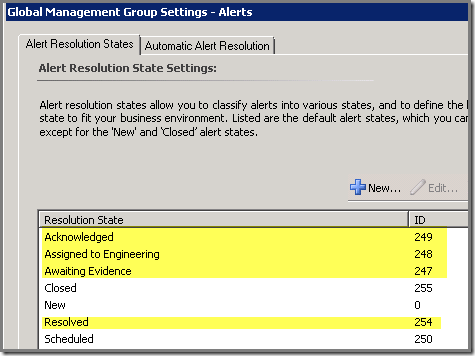
But what if you don’t have TFS in place or not going to synchronize it with OM12 SP1? And what if you don’t want the new Resolution States in OM12 since they simple clutter the overview of all available Resolution States and want only those Resolution States which are relevant to your organization?
Since I bump into this situations many times, I have decided to write this blog posting in order to answer the most common questions about what to do with these Resolution States.
- Should I remove these Resolution States?
Only when you’re 100% sure you’ll never going to use them. When there is the slightest possibility your organization is going to synchronize TFS with OM12 SP1, DON’T remove the related Resolution States. For now they’ll function like nothing more but place holders. But later they’ll be used. So don’t touch them.
- I am not going to use TFS synchronization, ever. So I want to remove the related Resolution States, but how?
These Resolution States are protected. Basically meaning they can’t be removed straight away from the Console. However, Daniele Muscetta wrote back in September 2008 a posting about how to modify the accessibility of the Resolution States, to be found here.
- Is this supported?
No, this isn’t supported, so you’re on your own here. Also know you can’t blame me neither, seriously. However, for some environments I removed the TFS related Resolution States and until now these OM12 SP1 environments are still running smoothly.
- I have removed the TFS related Resolution States. Can I use the IDs they previously used?
Yes you can. But I don’t know whether you should. Only when those IDs are really required for a connection with another product. In all other situations I prefer the approach to start with ID 10 and increment it by steps of 10, so: ID 10, ID 20, ID 30 and so on. This makes it easier to differentiate between the custom Resolution States and the default ones.
- Awesome! Now I am going to remove/alter the Resolution States ‘New’ and ‘Closed’ as well. Or shouldn’t I?
No you should NOT! This is the road to the destruction of SCOM, no matter what version you run. So NEVER EVER remove/alter those Resolution States.
- Okay, I want to modify our custom Resolution States so they can’t be deleted either. Can I do that?
Yes, you can. Simply modify the entry False to True in the column IsPredefined and you’re done. This helps you to protect your custom Resolution States from actual deletion.
Hopefully this Q&A assists you in making the right decisions when handling the Resolution States.
Wednesday, May 15, 2013
HELLO Exchange 2013 MP, GOODBYE Correlation Engine And Much More…
In the past the Exchange team and their MP developer peers already showed not being afraid of change or whole new approaches to monitoring Exchange server with SCOM, let’s take a look at the history of the MPs for monitoring the different versions of Exchange Server:
- Exchange Server 2003 MP
This MP had the (in)famous Self-Tuning-Threshold (STT) Monitors. In theory these STT Monitors are miracles of monitoring. In real life however they aren’t that good at all. The last iteration of this MP had many of these STT monitors replaced by the regular ones which reduced the noise significantly. This MP also used a tool, titled the Configuration Wizard for Exchange 2003 Management Pack. It helped people to get this MP configured in a fast way. However, this tool introduced new challenges as well. Overall this MP was noisy and had a high TCO because of the ongoing tuning.
- Exchange Server 2007 MP
This MP had no STT monitors what so ever. Also the separate Configuration Wizard used for the Exchange Server 2003 MP was dumped. Instead this MP was easily imported since all Monitors didn’t do anything. Simply because the related discoveries were turned of by default. Only one Discovery was running, the Discovery Helper. It showed people what Exchange 2007 servers were detected by this Discovery. When this was correct all other Discoveries could be turned on, one by one thus introducing a phased implementation of this MP. Many times the Discovery Helper identified servers as Exchange 2007 servers simply because the Exchange 2007 Server management tools were present. By tweaking this Discovery Helper process one could easily correct it, thus enabling correct monitoring of the Exchange Server 2007 environment. Overall this was a good MP and worked very well since it didn’t produced less noise and had a low TCO.
- Exchange Server 2010 MP
This MP is the most controversial MP the Exchange Server team introduced. It contained the Correlation Engine (CE) which was an additional process running on the RMS or OM12 MS server hosting the RMS Emulator Role. Again the theory behind the CE was very good, and still is. But in reality it introduced many unforeseen issues, like using some of the Custom Fields of the Alerts. Every Exchange Server 2010 Alert was processed by the CE which put some information into the Custom Fields of the Alerts shown in the SCOM Console. However, these same fields are used by Connectors and other similar processes which many time broke it. Another thing introduced were some whacky Data Sets which weren’t programmed very lean and mean. Because of it many of those queries contained in those Data Sets timed out, breaking the aggregation of raw data in the Data Warehouse, resulting in empty performance reports. This MP has seen many updates, some good and other outright bad. There was even an update which disabled mailboxes. So this MP has a whole history of its own and much of it isn’t that good at all.
No matter what one might think about it, it shows at least the Exchange Server team isn’t afraid of change and tries many new approaches when it comes down to the related Management Packs. And yes, many times I have cursed the Exchange Server 2003 MP and the Exchange Server 2010 MP. But at least these MPs go through a development cycle also after the first version has been released. Unfortunately the testing of those same MPs – before being released into the wild - didn’t prevent some serious issues hampering even more the already slightly negative experience index of the end users with this MP...
So now a new Exchange Server MP sees the light, the Exchange Server 2013 MP. And again this MP is totally different compared to its predecessor, because:
- The Correlation Engine is gone;
- The MP lacks the depth of its predecessor: it contains only some classes, and about 80 Monitors;
- No performance collection takes place what so ever;
- No Reports.
As the System Center Engineering Team states: ‘…each monitored Exchange server is responsible for monitoring its own health, and simply reports this via the Operations Manager agent. There is a little bit of roll-up going on, from Exchange server to Organization health. There are no special components running on the Operations Manager Management Servers…’
IMHO, this MP is just way too basic and misses out on collecting information required by many organizations. Also it plays down the role SCOM can play when monitoring a crucial service like e-mail. This MP reduces SCOM Agent to a proxy and skips all the intelligence present in any SCOM environment.
Yes, one could state the information required by those organizations is collected by Exchange Server 2013 itself. But why not expose that information to SCOM? Organizations want SCOM for many reasons, one of them being the SINGLE point where ALL information of many of their IT systems and services comes together. They don’t want anymore a huge collection of different points of information. A total overview is what they want and require.
Also the total lack of Reports isn’t a very good move either. IMHO, every MP should contain a set of Reports. Monitoring has grown up and has become far more then just looking at the current situation but also being able to report about how the situation has been in the past week/months and also being able to make future predictions.
So again the Exchange team and the related MP developers have chosen a course of action which I do not totally comprehend nor applaud to. I know my words sound harsh but I am just disappointed about the limited capabilities of this new Exchange Server 2013 MP. Hopefully future iterations of this MP will correct some of these ‘issues’ and missing (BASIC) features, like a mailbox count, mailbox size and so on…
The MP can be downloaded from here. The blog posting on the blog of the System Center Engineering Team about this new MP can be found here.
Tuesday, May 14, 2013
VMM 2012 Service Templates & Some Good Examples
In those very same private clouds Service Templates play a key role. Without them, your private cloud isn’t that exciting at all. Just a bunch of resources (compute, network & storage) people can ‘consume’ but that’s about it basically.
This is where Service Templates do come in. Instead of sharing resources, an entire organization is capable of deploying business applications as required WITHOUT going through the usual chorus which slows down the delivery of that same business application significantly. Instead with a few mouse clicks, the application is provided on a as-needed basis. And all the while it adheres to all company policies and requirements as well, simply because the Service Templates are build in such a manner that it’s fully compliant.
I know this is huge simplification of it all, but when all boiled down it is what it is and does.
So Service Templates have not only become key in VMM and the private cloud but also a challenge to get them right. So any good example is welcome in order to learn from it.
Therefore it’s good to know there are some very good blog postings out there all about building Service Templates:
- A series of blog posts around the deployment of a SharePoint Farm using VMM Service Templates;
Application Management-Example-Deploying a Service to Your Private Cloud (Part 1)
Application Management-Example-Deploying a Service to Your Private Cloud (Part 2)
Application Management-Example-Deploying a Service to Your Private Cloud (Part 3)
Application Management-Example-Deploying a Service to Your Private Cloud (Part 4) - Application Management – Service Templates, real reusable examples
And check out this track since more posings are coming up: http://blogs.technet.com/b/privatecloud/archive/tags/application+management+track/
New MP: Amazon Web Services MP
This MP is unique for a number of reasons (taken directly from the System Center Engineering blog):
- It is the first MP of its kind to be able to separate the computer (Operating System) from the AWS Instance (Virtual Machine).
- It creates a logical monitoring and reporting mechanism that can intelligently identify where a problem or error state exists, either in the AWS cloud or the server OS/application running within AWS.
IMHO, some other reasons why this MP is unique:
- Microsoft helped to develop this MP even though AWS is a competitor of Microsoft’s cloud portfolio (Azure);
- The MP is developed by VIAcode, a company which has an awesome and impressive track record for developing MPs.
Microsoft states they helped developing this MP in order to proof that System Center (read: SCOM) is capable of providing rich monitoring, alerting and reporting any application from any location in any cloud.
I haven’t tested this MP myself but not only Microsoft is totally happy about this MP but Amazon as well. And I know for sure they don’t want this kind of exposure when they don’t believe in it. So this MP must offer some very good things.
The MP can be downloaded for FREE and it’s good to know it comes in two flavors: SCOM 2007 R2 and OM12. I have checked the (online) guide and I must say, it looks pretty solid to me.
Here are the related links:
- Blog posting by the System Center Engineering Team;
- Blog posting by the AWS Team;
- Download location of the AWS MP;
- Online MP Guide.
So for anyone running SCOM 2007 R2/OM12 and using AWS, this MP is a MUST have!
New KB Article: SCOM 2007 R2 Agents & Teamed NIC Issue
A failing discovery = no monitoring which isn’t a good situation at all. KB2847767 tells it all. The issue, its cause and how to solve it.
Monday, May 13, 2013
Let’s Hack Some XML For Report Export To Another SCOM MG & Data Warehouse
Even though this feature works great it has ONE huge drawback: this MP can’t be exported and imported into another SCOM Management Group (MG) which runs another Data Warehouse database. Microsoft is pretty clear about it in it’s online TechNet documentation for SCOM 2007 R2 and OM12 SP1:
| Management packs can be exported and imported into other management groups and the reports will work only when these management groups share the same data warehouse. |
Yes, the MP itself containing those Reports can easily be exported from one MG and imported into another MP running a whole different Data Warehouse. But when those Reports are run into the other MG (where the MP is imported) this error is thrown: Object reference not set to an instance of an object: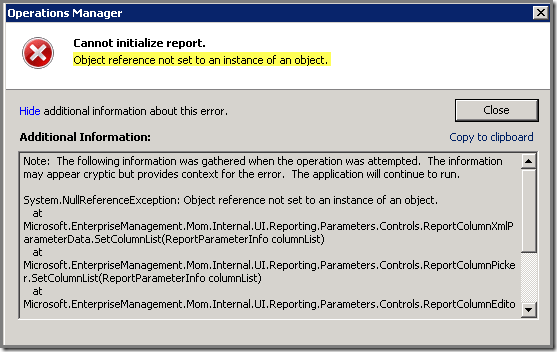
But with some quick editing the XML of this MP it can be exported to another SCOM MG using ANOTHER Data Warehouse database. Afterwards the Reports contained in that MP will still need some additional attention (selection of the correct Groups/Objects where the Reports are targeted against) but at least you don’t need to rebuild those Reports all over again, saving you a lot of time and hassle.
The steps involved
These are steps required to make it work:
- Create the Reports as required and save them to a single dedicated unsealed MP;
- When all the Reports are made export the MP;
- Open the related XML-file of the MP in a good editor like Notepad ++;
- Search for the entry <Parameter Name="ManagementGroupId">, like this:

The GUID defined between <Value> and </Value> has to be replaced by the ManagementGroupId of the MG where this MP will be imported; - Run the PS extensions on a MS of the MG where the MP exported in Step 2 will be imported and run this PS command: Get-SCOMManagementGroup | ft Id. Output will be like this:

Copy this GUID; - Replace all the GUIDs for the ManagementGroupId as stated in Step 4 with the GUID found in Step 5;
- Save the modifications to the XML file;
- Export this XML file into the new MG and presto, the Reports will run now (*).
(*: When Groups are used, the targeting of that Group will most likely go wrong. Simply select the correct Group and all other predefined parameter selections will be just fine. Now the Report will run successfully.)
Wednesday, May 8, 2013
Updated MP: Windows Server OS, Version 6.0.7026.0
Changes in this update:
- Fixed a bug in Microsoft.Windows.Server.2008.Monitoring.mp where the performance information for Processor was not getting collected.
- Made monitoring of Cluster Shared Volume consistent with monitoring of Logical Disks by adding performance collection rules. (“Cluster Shared Volume - Free space / MB”,”Cluster Shared Volume - Total size / MB”,”Cluster Shared Volume - Free space / %”,”Cluster Disk - Total size / MB”,”Cluster Disk - Free space / MB”,”Cluster Disk - Free space / %”)
- Fixed bug in Microsoft.Windows.Server.ClusterSharedVolumeMonitoring.mp where the Cluster disks running on Windows Server 2008 (non R2) were not discovered.
- Fixed bug 'Cluster Disk Free Space Percent' and Cluster Disk Free Space MB' monitors generate alerts with bad descriptions when the volume label of a cluster disk is empty.
- Added feature to raise event when NTLM requests time out and customers are unable to use mailboxes, outlook stops responding, due to the low default value for Max Concurrent API registry Key (HLM\SYSTEM\CurrentControlSet\Services\Netlogon\Parameters) , which is a ceiling for the maximum NTLM or Kerberos PAC password validations a server can take care of at a time. It uses the “Netlogon” performance counter to check for the issue.
MP can be downloaded from here.
Monday, May 6, 2013
Active Directory Integration (ADI) Notes From The Field
And of course were all these Windows servers production critical, so monitoring of those very same Windows servers was key.
After some investigation it turned out ADI wasn’t in place at all, it only seemed like it. And because the primary Management Server never failed before, the customer never noticed it. Until the primary Management Server became corrupted and went offline for many days. Now their most business critical servers became unmonitored simply because ADI was only partially in place causing the Windows servers being unable to fail over to the secondary SCOM Management Server.
Since ADI isn’t magic at all but requires some serious attention in order to get it up and running AND some mistakes seem to be common, I have decided to write this posting. There is much to share so let’s start.
First of all, what’s ADI and why use it?
ADI is a mechanism which uses Active Directory as a location to store configuration information for SCOM Agents which aren’t ‘pushed’ from the SCOM Console. ADI uses a Service Connection Point (SCP) which stores the information like the name of the SCOM Management Group, the primary SCOM Management Server and the failover Management Server.
For a more detailed description how ADI works read this posting written by Steve Rachui. Even though the posting is based on SCOM 2007 R2, it’s still valid for OM12 (SP1). Satya Vel also wrote a good posting about ADI, to be found here. Together these postings share a good deal of information about ADI so no need for me to repeat it here ![]() .
.
Common ADI Mistake 01
Only the MomADadmin.exe tool is run. But this tool is only ONE step of the whole process of configuring ADI in a proper manner. Actually, configuring ADI doesn’t start by running this tool, nor does it end with running this tool. So RTFM is key here, as described in detail in Steve Rachui’s previous mentioned blog posting.
Common ADI Mistake 02
For a whole configuration of ADI additional steps in the SCOM Console are required as well, so don’t forget them: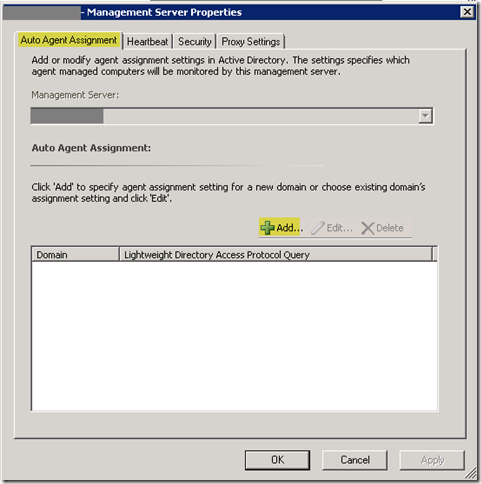
It might sound like: ‘Doh! I knew that already!’ but you would be surprised how many times I have seen people forgetting this step.
Common ADI Mistake 03
AD isn’t checked for the presence of the ADI container after the tool MomADadmin.exe is run. Even though this is a simple process (Check Yourself Before You Wreck Yourself). Simply open ADUC and check for the presence of the ADI container, named OperationsManager. Don’t forget to enable the Advanced Features (View > Advanced Features) or the ADI container will never be shown…
Common ADI Mistake 04
Misconfiguring the SCOM Agent. Suppose you run Citrix servers, based on a ‘golden’ image and these servers are spawned every morning brand new. The golden image contains a SCOM Agent, manually installed. So far so good since this kind of servers are really good ADI customers.
But when installing the SCOM Agent, please make the right choice when entering the Management Group Configuration screen.
This is the WRONG choice when manually installing a SCOM Agent which must use ADI:
Selecting the option Specify Management Group information: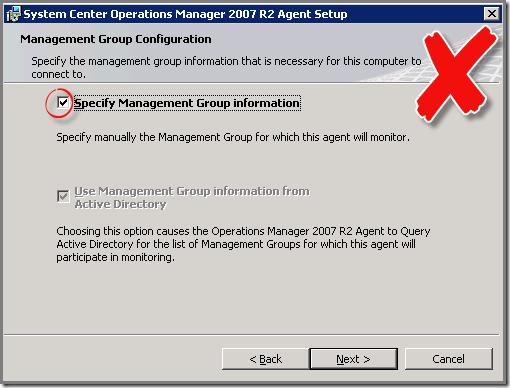
As a result a SCOM Agent installed like this will use the information provided by the user instead using ADI and without any further configuration, FAIL to failover to a secondary SCOM Management Server when the primary SCOM Management Server becomes unavailable.
This is the CORRECT choice when installing a SCOM Agent which must ADI:
Deselecting the option Specify Management Group information: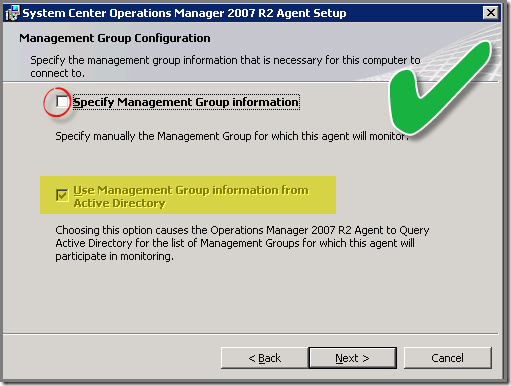
As a result the SCOM Agent will connect with the Active Directory SCP in order to get all the required information, thus this SCOM Agent will use ADI. Mind you, the option Use Management Group information from Active Directory will stay greyed out. This is normal! Simply click Next and the SCOM Agent will be installed with the ADI option enabled.
Common ADI Mistake 05
ADI isn’t tested! This is really too bad since NEVER EVER ASSUME, ALWAYS ASK & TEST! This prevents a lot of unwanted and unnecessary situations.
So when you think ADI is in place and fully configured, SIMPLY test it. Spawn a server with the SCOM Agent configured with ADI and look what it does. Does it connect to AD in order to obtain a configuration?
Do you EventID 2019 happening in the OpsMgr eventlog?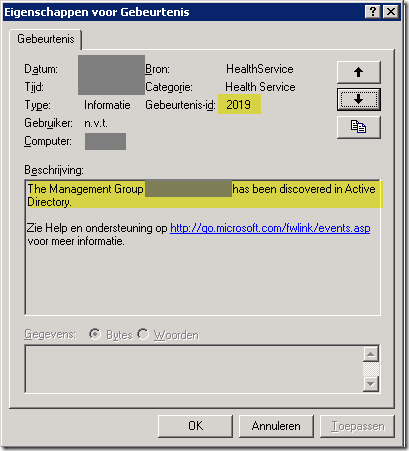
And how about EventID 20062 (telling ADI is enabled)?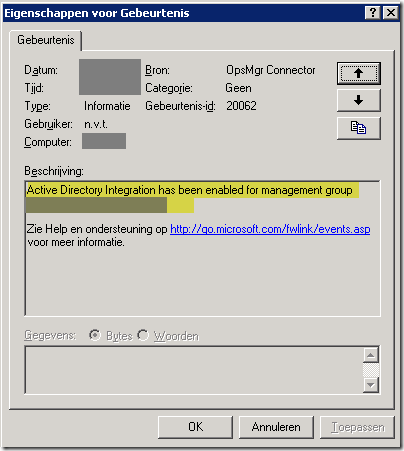
And does the SCOM Agent really work? Does is get a health status in SCOM? Are the MPs received and processed?
Another thing to test: Failover. When the primary Management Server goes offline, does the SCOM Agent failover to the secondary SCOM Management Server?
Of course, test this outside production hours but TEST it none the less. This way you’re sure the SCOM Agent is ADI enabled AND ADI works as intended.
Savision Fix For OM12 SP1 UR#2 Web Console Bug
The related blog posting will be updated to reflect the fix.
Compliments to the team of Savision. I contacted them about my findings and they thanked me for it. They also told me they were already working hard on a solution since they knew about the issue before I contacted them and were working around the clock for a fix. On top of it all they sent me the fix before it became publicly available, in order to run a final test against it so they knew for sure the fix works.
This is the way I like to see it: direct and open communications all aimed at the same target: to make a product work as intended. So thank you Savision!
The updated MPs can be downloaded from here.
Friday, May 3, 2013
Bug Alert: SharePoint Server 2013 MP Issue - Not All Reports Are Uploaded To SSRS
This error is thrown in SCOM:
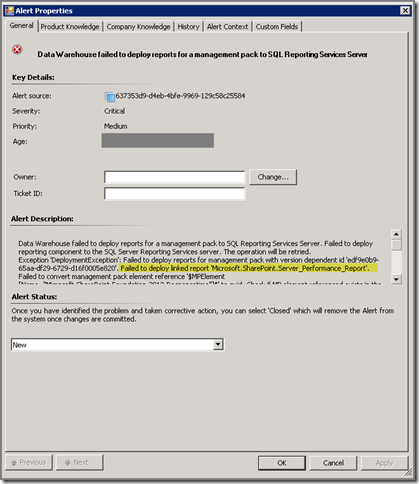
| Data Warehouse failed to deploy reports for a management pack to SQL Reporting Services Server. Alert Description: Data Warehouse failed to deploy reports for a management pack to SQL Reporting Services Server. Failed to deploy reporting component to the SQL Server Reporting Services server. The operation will be retried. Exception 'DeploymentException': Failed to deploy reports for management pack with version dependent id 'edf9e0b9-65aa-df29-6729-d16f0005e820'. Failed to deploy linked report 'Microsoft.SharePoint.Server_Performance_Report'. Failed to convert management pack element reference '$MPElement[Name="Microsoft.SharePoint.Foundation.2013.Responsetime"]$' to guid. Check if MP element referenced exists in the MP. An object of class ManagementPackElement with ID 75668869-f88c-31f3-d081-409da1f06f0f was not found. One or more workflows were affected by this. Workflow name: Microsoft.SystemCenter.DataWarehouse.Deployment.Report Instance name: 637353d9-d4eb-4bfe-9969-129c58c25584 Instance ID: {E9830B88-8A99-8F84-5EB3-EB7CEABFE473} Management group: XYZ |
None of the tricks to get this working gives a positive result. The only Reports to be found in OM12 are:
- Microsoft SharePoint Foundation Core Library > Report: SharePoint Foundation Performance;
- Microsoft SharePoint Server Core Library > Report: SharePoint Server Performance.
But MP Viewer shows there are more Linked Reports present in this MP:
On the TechNet Forum I found this thread all about the same issue. No matter what version of SQL Server you’re running, it happens. Doesn’t surprise me since the Alert clearly states it’s a MP related issue (…Failed to deploy linked report 'Microsoft.SharePoint.Server_Performance_Report'. Failed to convert management pack element reference '$MPElement[Name="Microsoft.SharePoint.Foundation.2013.Responsetime"]$' to guid…).
I wonder how many readers of this blog experience the same issue. So leave a comment to this posting (every comment has to be moderated by me before it appears on my blog, simply because the blog got way too much spam by using the comment option. On an average week I mark about 100+ comments as spam… So when you leave a comment it might take some time before you see it appear).
Bug Alert: SharePoint Server 2013 MP Issue - Not All Reports Are Uploaded To SSRS
2013-10-17 Update:
The latest version of this MP fixes this issue. Go here for more information about it.
Bumped into this issue where the SharePoint Server 2013 MP, version 15.0.4420.1017 doesn’t upload all Reports, contained in this MP, to the SSRS instance used by OM12.
This error is thrown in SCOM:
| Data Warehouse failed to deploy reports for a management pack to SQL Reporting Services Server. Alert Description: Data Warehouse failed to deploy reports for a management pack to SQL Reporting Services Server. Failed to deploy reporting component to the SQL Server Reporting Services server. The operation will be retried. Exception 'DeploymentException': Failed to deploy reports for management pack with version dependent id 'edf9e0b9-65aa-df29-6729-d16f0005e820'. Failed to deploy linked report 'Microsoft.SharePoint.Server_Performance_Report'. Failed to convert management pack element reference '$MPElement[Name="Microsoft.SharePoint.Foundation.2013.Responsetime"]$' to guid. Check if MP element referenced exists in the MP. An object of class ManagementPackElement with ID 75668869-f88c-31f3-d081-409da1f06f0f was not found. One or more workflows were affected by this. Workflow name: Microsoft.SystemCenter.DataWarehouse.Deployment.Report Instance name: 637353d9-d4eb-4bfe-9969-129c58c25584 Instance ID: {E9830B88-8A99-8F84-5EB3-EB7CEABFE473} Management group: XYZ |
None of the tricks to get this working gives a positive result. The only Reports to be found in OM12 are:
- Microsoft SharePoint Foundation Core Library > Report: SharePoint Foundation Performance;
- Microsoft SharePoint Server Core Library > Report: SharePoint Server Performance.
But MP Viewer shows there are more Linked Reports present in this MP:
On the TechNet Forum I found this thread all about the same issue. No matter what version of SQL Server you’re running, it happens. Doesn’t surprise me since the Alert clearly states it’s a MP related issue (…Failed to deploy linked report 'Microsoft.SharePoint.Server_Performance_Report'. Failed to convert management pack element reference '$MPElement[Name="Microsoft.SharePoint.Foundation.2013.Responsetime"]$' to guid…).
I wonder how many readers of this blog experience the same issue. So leave a comment to this posting (every comment has to be moderated by me before it appears on my blog, simply because the blog got way too much spam by using the comment option. On an average week I mark about 100+ comments as spam… So when you leave a comment it might take some time before you see it appear).
Thursday, May 2, 2013
OM12 SP1 UR#2 Web Console Error: System.Reflection.ReflectionTypeLoadException: [ReflectionTypeLoad_LoadFailed]
Savision has released updated MPs which fix this issue, as described here. So when you’re experiencing these issues, download the updated MPs, import them and be done with it.
I have seen this issue already a couple of times:
- OM12 SP1 with UR#2 is in place;
- Savision Live Maps is in place;
- Savision Live Maps MPB (Management Pack Bundle) Savision LiveMaps Presentation Summary Widget Library is imported (done automatically when installing the Savision Web Console).
When the OM12 Web Console is launched, this error is thrown: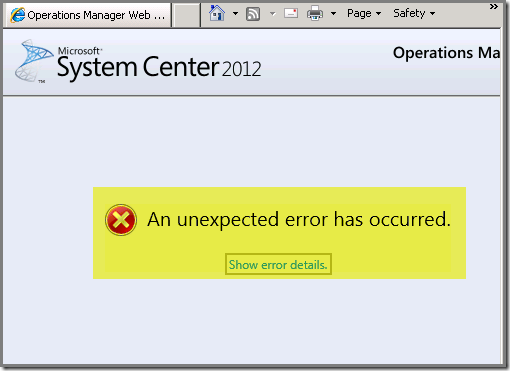
Error details:
| Please provide the following information to the support engineer if you have to contact Microsoft Help and Support : System.Reflection.ReflectionTypeLoadException: [ReflectionTypeLoad_LoadFailed] |
The default/basic troubleshooting steps didn’t help here, the error remained:
- Running from an elevated cmd-prompt the command IISRESET;
- Re-register asp.net (C:\Windows\Microsoft.NET\Framework64\v4.0.30319]\aspnet_regiis.exe -i –enable);
- Removing the OM12 Web Console and reinstalling it.
So it was time for a deep dive into OM12.
Dive, dive!
Based on this posting I stopped the OM12 tracing which runs by default. This tracing must be stopped so new clean – and far more easier searchable logs - are created. This tracing is stopped by typing this command in a cmd-prompt: ~:\Program Files\System Center 2012\Operations Manager\Server\Tools\StopTracing.cmd.
Then I emptied the log file folder. For OM12 this is the folder C:\WINDOWS\Logs\OpsMgrTrace. Now all is clean and ready for a new log file to be created by the tool TraceConfig.exe, (start it with elevated permissions(!))located in ~:\Program Files\System Center 2012\Operations Manager\Server\Tools.
All Trace Areas related to the UI (User Interface) were selected by me and the trace was started by hitting the Start button in the same program.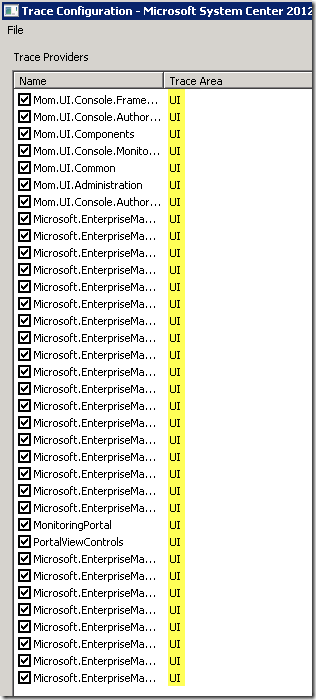
Then I started the OM12 Web Console again, and let it run until the error popped up again. Tracing was stopped in the same tool and in the cmd-prompt I used to stop the tracing which runs by default, I entered this command: ~:\Program Files\System Center 2012\Operations Manager\Server\Tools\FormatTracing.cmd.
After a few minutes a nice readable log file was created, C:\WINDOWS\Logs\OpsMgrTrace\OpsMgrCustom.log.
The culprit…
To my surprise I noticed an issue with a MPB from Savision, the Savision LiveMaps Presentation Summary Widget Library:
| [1]4072.7424::05/02/2013-15:39:43.651 [Microsoft.EnterpriseManagement.Presentation.Security] [] [Information] :DeclaredAssemblyDataProvider.GetDependencyAssemblies{declaredassemblydataprovider_cs463}DeclaredAssemblyDataProvider: GetDependencyAssemblies: Got 0 dependency assemblies for primary assembly Savision.LiveMaps.Presentation.SummaryWidget.SLUnitComponentsAssembly |
Could it be this MP caused the broken OM12 Web Console?
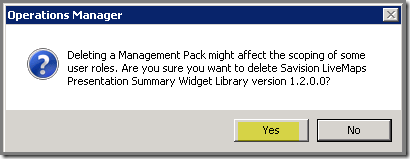
Time to put it to the test by simply removing it (this MP is found in the program folder of Savision Live Maps: ~:\Program Files\Savision\Live Maps for OpsMgr 2012\Authoring Console\Management Pack\Savision.LiveMaps.Presentation.SummaryWidget.Library.mpb, so it’s easily imported again.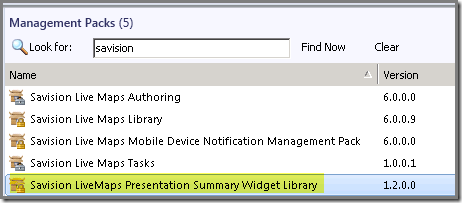
After the MP was removed, I run the OM12 Web Console again, and: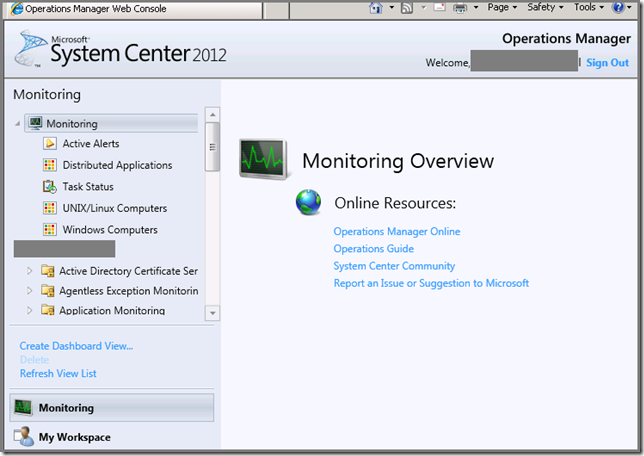
YES! The OM12 Web Console is back again! BUT….
Removing this MP breaks the Savision Web Console how ever: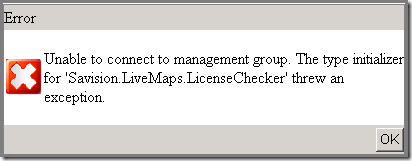
Running the Savision Live Maps Web Console Configuration tool fixes it again by importing the Savision LiveMaps Presentation Summary Widget Library MPB which breaks – as we do know now - the OM12 Web Console… So you have to decide what’s more important:
- A functional OM12 Web Console and a broken Savision Web Console, resulting in the OM12 Web Console NOT being able to show the Savision Live Maps,
- Or a functional Savision Web Console with a broken OM12 Web Console…
Recap
Whenever you experience the same issues as described in this posting, remove the Savision MPB Savision LiveMaps Presentation Summary Widget Library and see how it goes from there.
I have good contacts with Savision so I have sent them the log file hoping they’re capable of solving this issue since Savision delivers quality products and are dedicated to reliable and good software. This posting is only intended to help other people who’re experiencing the same issues as I did.
New MP: Windows 8 Client Operating System, Version 6.0.7024.0
Features of this MP (taken directly from the website):
- Key Processor Performance Indicators
- Logical and Physical disk performance and free space
- Memory utilization
- Network health
- Health monitoring of key Windows Operating System services
- Comprehensive performance collections
- Availability and event reports
MP can be downloaded from here.
This MP is supported on OM12 and higher. Even though I haven’t tested it, I think it should work with SCOM 2007 R2 as well, as long as the Windows 8 systems are running an OM12 Agent. This kind of setup is only allowed when you’ve the proper licenses in place.

