
So stay tuned. For now, I wish you all the best for 2015.

So stay tuned. For now, I wish you all the best for 2015.
My blog will be silent for the week during Christmas. The days before New Year I’ll do my best to publish some postings. But for now I want to wish all the readers/visitors of this blog a Merry Christmas.
And thank YOU for visiting this blog and all your comments. It’s what makes my blog standing out of the crowd. Awesome!
Prelude…
Sometimes I find myself in situations which give me the ‘Duh!’ feeling, like doing something wrong and not being able to fix it at that moment. However, when trying to solve it a day later, it’s fixed in the matter of minutes while the day before the solution eluded me totally. And not only that, but when I solve it, I don’t feel that smart either since I know I stepped into a well known pitfall which I should have avoided…
For me these are signals it’s time for a break and gladly within a few weeks I’ll have a break of one whole week! Nice!
Issue
Got this error when I tried to delete a certain Web Application Transaction Monitor: The item you are trying to delete cannot be deleted because another object references it. The object must be deleted before this item can be deleted: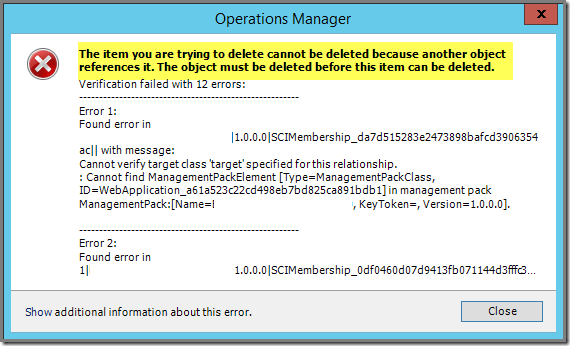
But at that moment I couldn’t crack it. Yes, there was a Distributed Application using this very same Monitor. So normally you remove that DA first (or modify that DA so it doesn’t use that particular Monitor anymore).
But also the DA kept throwing similar errors! And the cause of that eluded me. Instead of wasting valuable time, I exported the MP containing this Monitor and set it aside for another day. Simply because I already felt that I was missing something very obvious here…
Cause
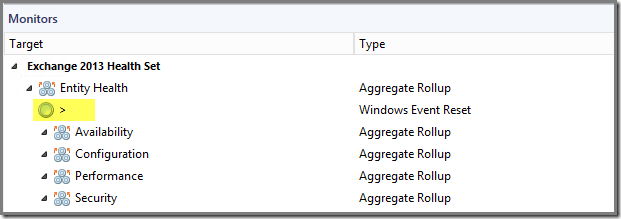
As it turned out, that particular Monitor was used in a DA. But that DA had some other modifications as well, like newly added Dependency Monitors, in order to enable the rollup of the Performance, Security and Configuration parent monitors as well.
After having removed those Dependency Monitors, one by one, I could easily remove the DA containing that Monitor. And afterwards I could easily remove the Web Application Transaction Monitor.
Recap
Whenever the removal of any Web Application Monitor throws errors like item you are trying to delete cannot be deleted because another object references it. The object must be deleted before this item can be deleted, that Monitor is being used (referenced) in one ore more DAs.
When removing that DA throws the same error as well, changes are that you have some modifications on that DA as well.
So start with the removal at the bottom and work your way up. By removing all the references one by one, soon you’ll end at the Web Application Monitor involved and than you can remove that Monitor without any hassle.
Update December 9th 2014: Based on some good and valid feedback from PFE Microsoft Germany I’ve decided to update this posting with their advice and experiences from the field:
The bigger your SCOM environment gets, the better it is to test different MDoP (MAXDOP) settings. Simply because the MDOP Calculator mentioned in this posting, might not always give you the best MDoP values for SCOM. Also in virtualized environments many other factors play an important role as well. For instance, PFE Germany bumped into an environment with 5000+ SCOM Agents. The recommended MDoP setting was 8 but as it turned out, a reduction to 4 for MDoP worked better.
So: TEST YOURSELF BEFORE YOU WRECK YOURSELF.
A BIG word of thanks to Microsoft Germany PFE for their valid feedback and their willingness to share their own experiences from the field.
Issue
A dead slow SCOM 2012x Console. No matter what we did, there was only some minor improvement. And yes I know. The SCOM 2012x Console isn’t speedy at all. It’s by design apparently ![]() . One of the biggest drawbacks of SCOM 2012x and also of SCOM 2007x.
. One of the biggest drawbacks of SCOM 2012x and also of SCOM 2007x.
But in this particular case it was dead slow. Even for SCOM 2012x it was totally unacceptable. So even when tuning SQL and the related SCOM Operations database, temp databases and disks to the max as the environment allowed for, the SCOM 2012x Console became a bit faster. But still no good and still frustrating.
So it was time for some deeper investigation and searching on the internet. And suddenly I bumped into this blog posting written by S.Carrilho, all about "mDOPING" your SCOM Console performance with some simple SQL tips.
And as it turned out, the change of speed is AWESOME! Let me first try to explain what MDoP is and does.
Time to meet Max Degree of Parallelism (MDoP)
MDoP = When SQL Server runs on a server with more than one processor or CPU, it will try to find the best level of parallelism by itself. Parallelism is the number of processors used to run a single statement, for each query which has a parallel execution plan.
So far so good.
Out of the box will SQL Server detect by itself what level of MDoP to use. HOWEVER, on servers using hyper threading this won't work out too well. Simply because SQL Server thinks there are more processors/CPUs present than there actually are. This happens on physical and virtual servers alike as long as hyper threading is enabled.
In cases like these it's better to set that value by yourself, for instance by using this MAXDOP Calculator. Otherwise SQL Server will use all the available processors it thinks it has resulting in serious performance issues…
Example
In this example I’ll use the MAXDOP Calculator on my test environment.
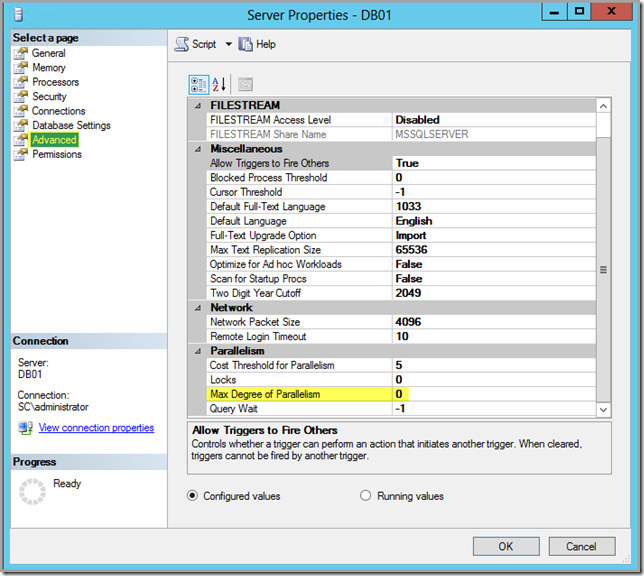


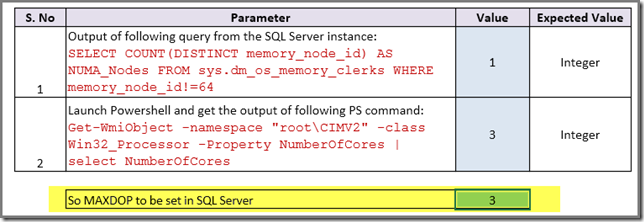

Recap
Never I heard of MDoP before not how hyper threading can throw SQL Server of it’s track when setting MDoP for itself. When using dedicated SQL Server instances for SCOM it certainly pays of to check the MDoP setting which is currently used and compare it by what the MAXDOP Calculator tells you is best.
When working with dedicated SQL admins, keep them in the loop and – even better – in the lead. And for this customers I’ve noticed some awesome improvements. From dead slow to a workable situation. Still no Ferrari but the current SCOM Console will never get to that level.
Perhaps this setting can be applied for other System Center components as well. Until now I haven’t seen that modifying the MDoP setting had a bad influence. But always check it with the SQL experts ![]() .
.
Resources
These are the resources I’ve found all about MDoP, in general and related to SCOM and other SC components:
A few days ago Microsoft Press released a new book, all about extending SCOM 2012x Reporting. And yes this book is FREE ![]() .
.
Don’t know whether this book makes a real deep dive, but it’s a start at least and it’s FREE ![]() . Want to know more? Go here.
. Want to know more? Go here.
Bumped into this posting on UP2V:
So when you’re interested, go here.
How I met requiretty…
A few days ago I was asked a question about monitoring UX based systems with SCOM 2012x. Even though I’ve already helped to monitor 500+ UX systems with SCOM 2012x, this question was totally new to me and I even didn’t know at first what it meant ![]() .
.
The question was: ‘We use requiretty on all of our UX systems. However, the OM12x UX Agent doesn’t work with that setting turned on. Does the OM12x UX Agent only function without this setting turned on?’
What to do with it…
So it was time to visit the internet in general and one website in particular: Unix & Linux StackExchange, all about UNIX and Linux related stuff. And soon I found two interesting webpages:
But still no clue about what requiretty is
So soon enough I had found what I was looking for. But still requiretty itself eluded me. Gladly I could ask all I wanted to know about requiretty since another customer has this awesome RHEL engineer working for them. He’s a kind of person who would have invented RHEL himself if it wasn’t there already. He eats, drinks and breaths RHEL ![]() .
.
So I asked him whether he knows anything about requiretty. And first he didn’t know what I was talking about until I wrote it down. Even though one writes requiretty it’s pronounced as Require TTY ![]() . And as soon as I wrote it down, he recognized it right away and started talking and talking and talking…
. And as soon as I wrote it down, he recognized it right away and started talking and talking and talking…
What RequireTTY is and does
This is my translation of what I’ve been told. So when I am wrong or not complete mind you I am anything but an UX kind of guy…
As it is pronounced, it’s a security setting in UX, like RHEL based systems. Here you can make the usage of TTY (the RHEL ‘user interface’) a hard requirement. Anything running on that system requires TTY or else it won’t be allowed to run.
However, the SCOM 2012x UX Agent is nothing more but a web service. So it runs in the background and doesn’t use the TTY at all. And when it’s set to use it, or else it’s blocked, it simply won’t run.
How to deal with it when RequireTTY is enabled on the UX system?
Pretty easy actually. For RHEL based systems you can turn RequireTTY off for a certain command or user. So in this case disable it for the SCOM2012x UX Agent and you’ll be just fine. The UX system will keep on running RequireTTY and the SCOM 2012x UX Agent will keep on running.
I guess many of us have faced the challenge how to synchronize MPs between different Management Groups, like testing and production. Yes, the manual approach is doable when it’s a one time process. But how about it when it needs to be done on regular intervals?
Is Orchestrator the way to go? Is the time required to build such a workflow to be justified? Because it will be much more than just a simple export > import job. One needs to reconsider many different aspects.
Gladly, my highly respected friend and fellow MVP Cameron Fuller has written an excellent posting about this topic WITH the solution for it, based on PS.
For everyone running more than ONE MG, I highly recommend this posting. It contains tons of solid information and a good solution as well. Awesome!
Credits:
All credits go to Cameron Fuller for sharing these awesome PS scripts. Thanks man! Sharing = Caring!

Suppose YOU’re the boss for the team building the next generation of Microsoft Management Packs. And there are NO limits. No budget constraints. And limitless resources are available. There is only one thing to do:
Build the next generation of Microsoft MPs which will blow everyone of their feet…
What would you do different? What would you scrap? What would you keep and what would you add? Also think about presentation (dashboarding, reports and so on). What kind of functionality are you missing in todays Microsoft MPs which should be present in the next generation?
I know. A situation like this won’t happen. BUT…
Suppose I’ve got contacts. And they asked me to provide them with information about what the next gen of Microsoft MPs should look like. What those MPs should do and shouldn’t do. How those MPs should function. What these MPs should fix in todays MPs.
And no, this is NO fantasy. As a matter of a fact I’ve been asked such questions quite recently. And I’ve answered them. But you know, that’s just me. I know many people who are working knee deep in the boiler room of SCOM, AKA ‘the trenches’. So why not ask them as well in order to get a WHOLE list of items my contacts can work with? Wouldn’t that be awesome?!
That’s why I am asking YOU to tune in and leave your comments on this posting.
Those comments will be forwarded to the right people who are about to start soon on the next generation of Microsoft MPs. I know for sure they’ll do their utmost best to incorporate as much as possible of those highly valued comments. They’re eager to hear from YOU!
So speak NOW and changes are your highly valued comments will be incorporated
into the next gen of Microsoft MPs!!!
Issue
The health of the operational SCOM database is crucial for a smooth running SCOM 2012x Management Group. For instance, when too much data comes in and this database grows out of control, soon your SCOM 2012x MG will come to a stand still.
So how to recognize situations like these? Of course, you’ll notice a slower performance of the SCOM Console for instance, also a Warning Alert raised by the Monitor Operational Database Space Free (%) when the percentage of free space falls beneath the 40% and a Critical Alert when the percentage of free space falls below the 20%.
But still, when this happens it’s already a bit too late. Therefore it makes sense to run certain reports once per week, just to stay in control of your SCOM 2012x environment. This posting describes the reports which have helped me many times before and are a great help to me.
SCOM 2012x Reports & the Community
Yes, SCOM 2012x delivers out of the box some good reports in order to see what’s happening under the hood of your SCOM MG. None the less, some additional help is welcome, delivered by the Community.
In the days of SCOM 2007x some people build the SCC Health Check Reports MP, containing 25+ Reports delivering a good and deep insights in the state of the nuts and bolts of your SCOM environment. And even though this MP isn’t updated for SCOM 2012x, it runs just fine up to SCOM 2012 R2 UR#4. And delivers tons of good information. So my advice: download this MP, create the additional Data Source (as described in the related MP Guide), import the MP and enjoy the magic ![]() .
.
SCOM 2012x Reports
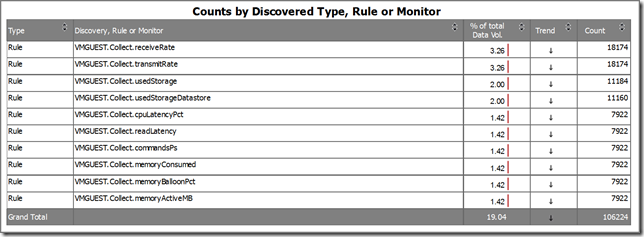
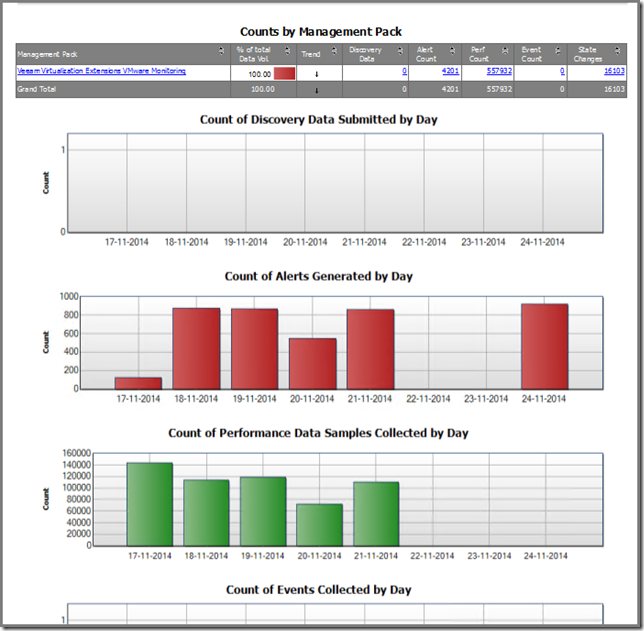
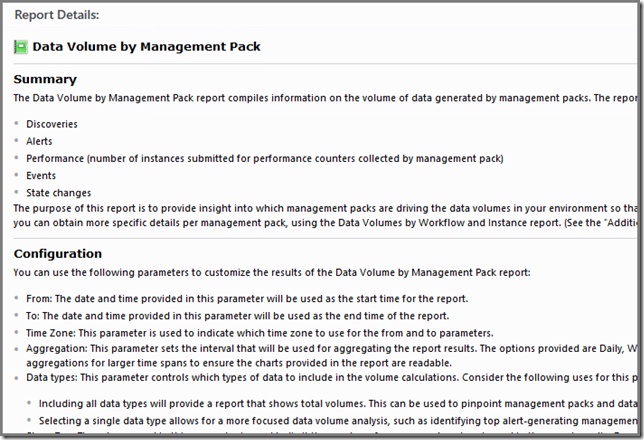
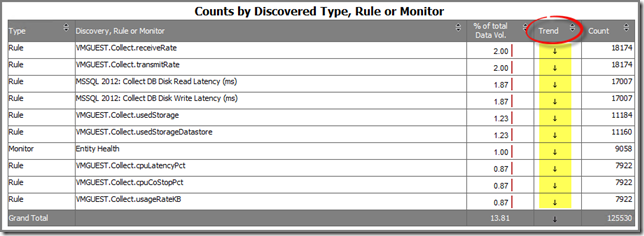
These are the reports I use in order to gain a good insight about the health state of the SCOM 2012x environment, all found under the reporting node System Center Core Monitoring Reports:
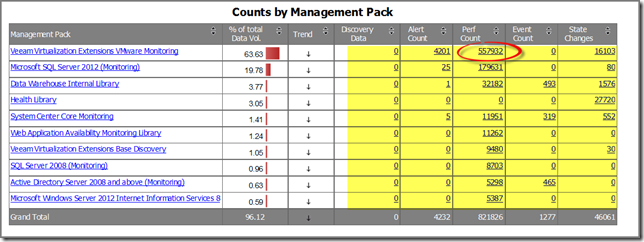
SCC Health Check Reports
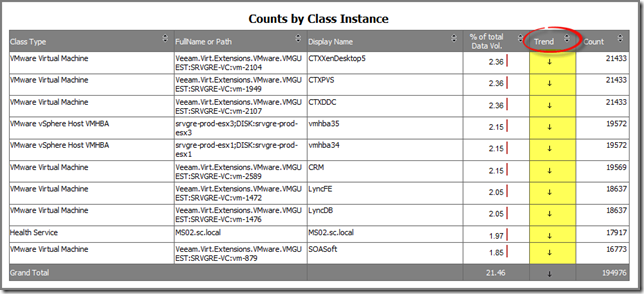
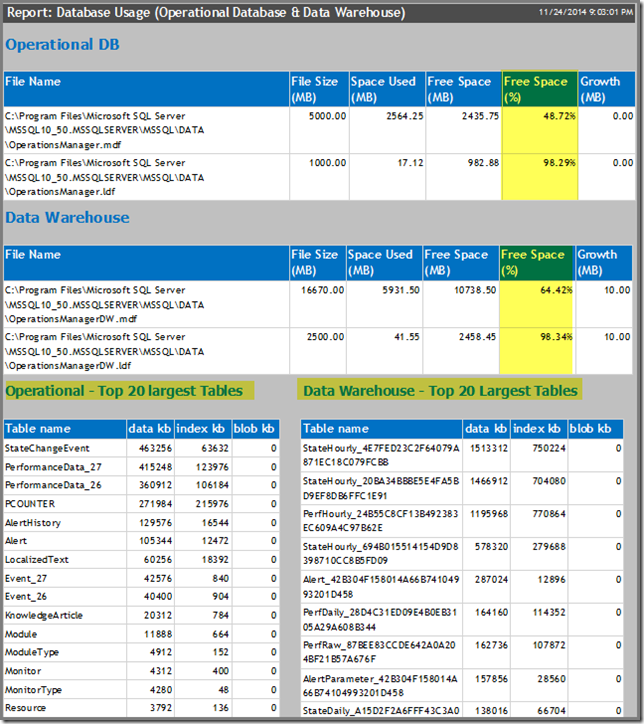
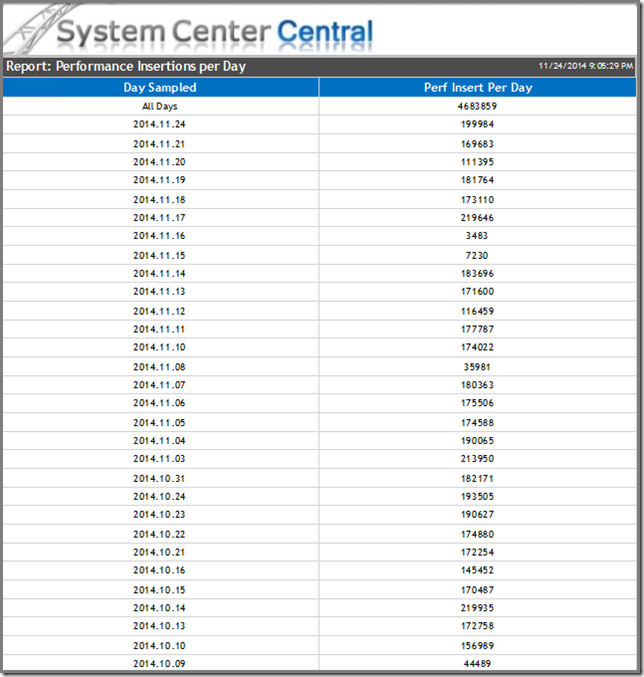
With the two previous reports you already gained a deeper insight of your SCOM environment. However, additional information is welcome and now it’s time to run a set of reports from the SCC Health Check Reports MP. With them you have a complete picture of the state of the operational database of your SCOM environment.
Even though these are ‘single-click’ reports (no parameters are required, when double clicked the just run and show you the information), in certain circumstances I want to be a bit more in control, like the time frame selection and so on. In cases like these I run the relevant queries directly against the operational database. In most cases however, these reports deliver all the information I need and are awesome because they’re so easily used.
Performance - Top 20 Performance Insertions By Perf (OM)
This Report shows what Objects and their related counters collects the most performance data and puts it into the operational database. This helps you to pinpoint problematic systems/objects.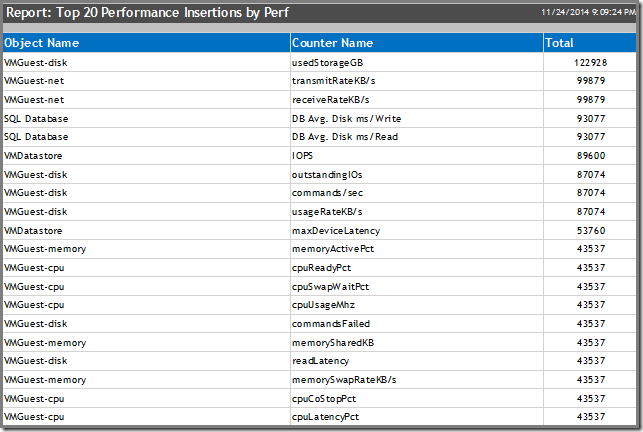
Performance - Top Performance Baseline Generating Rules (OM)
Yes, STTs (Self Tuning Thresholds) are still alive and kicking. But I don’t like them at ALL! Simply because they don’t work as intended. The idea was good: STTs would establish a baseline themselves. A lower and upper one. When performance happens between those baselines, all is well. When outside (below or over) the thresholds, an Alert will be raised.
The Exchange Server 2003 MP was full of those STTs in the first version of that MP. The last version of that MP contained far less STTs AND the remaining ones were set to whole different (fixed) values.
So this Report will show the Rules using that STT technology. My advice: when experiencing issues of too much performance data being collected? Kill those STT Rules! For now I suspect only the SQL MP using STT Rules:
- MSSQL 2005: Collect Learning Data for SQL User Connections Monitor;
- MSSQL 2008: Collect Learning Data for SQL User Connections Monitor;
- MSSQL 2012: Collect Learning Data for SQL User Connections Monitor.
As you may have noticed, most of these Reports are aimed at getting an insight about all the performance data being collected. Simply because many times the main reason for your operational database being hammered is that too much performance data is coming in.
When you’ve found the culprit additional tuning is required. Not by simply turning those Rules off, but by selecting other intervals and so on.
No performance data collection issue?
What if performance data collection isn’t an issue? Check out the status of the other SCOM nuts and bolts with these SCC Health Check Reports:
Alerts
Alerts - Top 20 Alerts By Alert Count (OM)
Alerts - Top 20 Alerts By Repeat Count (OM)
Config Churn
Config Churn - Discoveries Last 24 Hours (DW)
Config Churn - Modified Properties Details Last 24 Hours (DW)
Too many events coming in
Events - All Events Count By Last 7 Days (OM)
Events - Most Common Events by Number and Publisher (OM)
Events - Top 20 Computers Generating the Most Events (OM)
State data
State - Noisiest Monitors (OM)
State - Old State Changes Not Groomed (OM)
State - State Changes Per Day (OM)
As you can see, SCOM can be a challenge to master. But these Reports will help you to get on track. And don’t forget the community either ![]()
This version includes these modifications (taken directly from the website):
Website can be downloaded from here.
Microsoft released an update for the SCOM 2012 R2 JEE Application Servers (2014/10), version 7.5.1038.0. MP can be downloaded from here.
I know. Exchange Server 2010 isn’t the latest & greatest. And SOON the Mainstream Support End Date for it will be reached, on the 13th of January 2015:
So I guess it’s time for many organizations to make a move to either the latest and greatest Exchange on-premise version OR to move to Office 365 (or to make a combination of both).
None the less, many organizations are still running Exchange Server 2010 AND use SCOM 2012x in order to monitor it. Even though I’ve written many postings about the Exchange Server 2010 MP, there are some things to reckon with when running SCOM 2012x.
This posting is a small overview of the most important things:
There is more, but these are on top of my list. Otherwise read all my postings about the Exchange Server 2010 MP. The best thing to do is to migrate away from Exchange Server 2010 and to Exchange Server 2013 for instance. At least it has a decent MP now ![]() .
.
Issue
However, when trying to build some customized Reports for SCCM 2012x, one is bound to bump into this error, when Microsoft SQL Server Report Builder is run from any other server than the SQL Server hosting the SCCM 2012x database: Microsoft SQL Server Report Builder Error: Unable To Connect To Data Source. The Certificate Chain Was Issued By An Authority That Is Not Trusted: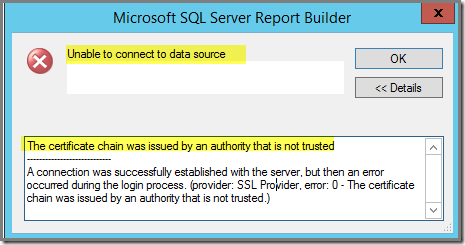
Cause
When SCCM 2012x is installed, a self signed Certificate is automatically created on the SQL server hosting the SCCM 2012x database. This certificate is used for communication with the SCCM 2012x database and required by any other system connecting directly to this database.
Solution
The solution is simple and straight forward. I write it down in an high level overview since I expect you to have enough experience to fill in the ‘blanks’ ![]() .
.

Microsoft is looking for SCOM users to help them to make SCOM a better product!
So this is YOUR change to participate with Microsoft and communicate with the SCOM team directly in order to influence the new version of SCOM!
Want to know more? Go here.
However, the Cisco UCS MP uses another mechanism so disabling/modifying the related Rules/Monitors won’t fly here. Simply because the severity level isn’t set within those Rules/Monitors but on Cisco UCS Domain level and translated/parsed by the Cisco UCS Management Service, a component which is a part of the Cisco UCS MP.
Finally I thought I had found it. The earlier mentioned Cisco UCS Management Service has some good configuration items, among it the Fault Filter which is empty by default. So I thought creating a filter only stating the Alerts which get an Informational severity level in SCOM would filter them out: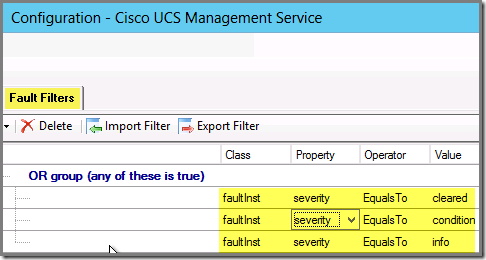
HOWEVER, now all other Cisco UCS Alerts NOT having the severity level Informational disappeared and the Informational Alerts returned…
Cause
As it turns out (described many pages deeper in the Cisco UCS MP Guide, duh!…) when the Fault Filter has some one or more filters defined, it will ONLY pass on the Alerts matching those same filters, NOT STOPPING THEM!
Solution
So I redefined the Fault Filter where I only defined the Alerts which get a Warning or Critical severity level in SCOM: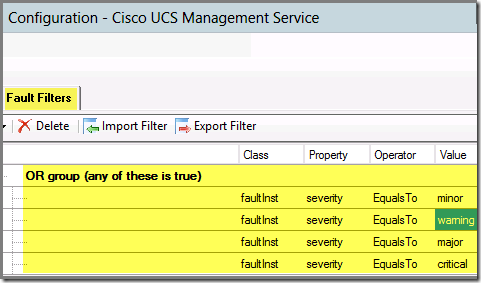
And after applying it, the Information Cisco UCS Alerts disappeared and the Warnings and Criticals reappeared. Awesome!
Advice
The same component – Cisco UCS Management Service – also shows you what the default severity mappings CISCO UCS > SCOM are, see tab Severity Mapping: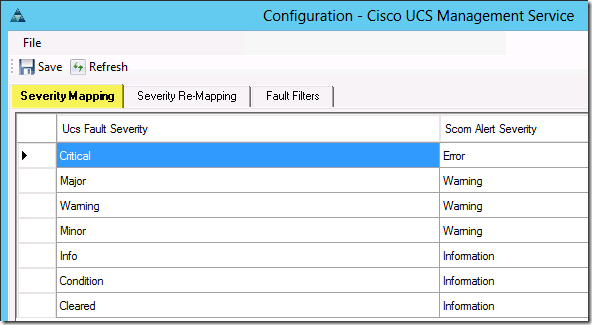
It even allows you to remap UCS severity levels to other severity levels in SCOM.
DON’T FORGET TO RUN THIS COMPONENT WITH ELEVATED PERMISSIONS. OTHERWISE YOUR CISCO UCS DOMAINS WON’T BE LOADED SO YOU CAN’T MODIFY THE FAULT FILTERS.
Credits
All credits go to Oleg Kapustin for this posting. He’s the one who made the deep dive in order to find the true cause of this issue and also came up with two workarounds. Awesome job Oleg!!!
Issue
Last week when I published my blog posting about the latest & greatest Exchange Server 2013 MP, one reader told me that he had issues with the email notifications sent out for this MP: ‘…All of the notification emails for these alerts only contained {2} for the Subject and Alert Name…’
Cause
As it turns out, this is NOT an issue related to the Exchange 2013 MP but has everything to do with an issue (bug?) in the SCOM Notification Engine, as described here.
Workaround
Gladly I know a lot of good people in the SCOM Community, one of them being Oleg Kapustin. So I contacted him about this issue. He investigated it AND decided to write a new posting for his blog about this issue and to describe two workarounds for it.
Want to know more? Go here.
Advice
Anyone running the latest and greatest Exchange Server 2013 MP should read Oleg’s posting.
Issue
With OSD HP Hotkey drivers for HP notebooks won’t install by default. Only after a second reboot these drivers will install. To incorporate this into OSD can be done (I think) but takes much time to get it right. So I decided to make a Package and to deploy it to a Device Collection containing these HP Notebooks.
On itself nothing exciting but the way HP packages these drivers made it a challenge. At the end it’s a MSI file BUT it’s wrapped with InstallShield. And when running it silent, the reboot is forced, no matter what. And that’s something I don’t want to happen.
Research
As stated before, the InstallShield wrapper contains a MSI package. With MSI it’s easy to run a silent installation and opting out the reboot so the user can reboot the system at their convenience.
Fix
Finally I found this posting on ITNINJA, helping me out, especially this entry: When you run the exe, it extracts to C:\SWSetup\SP47618 (or something like this) which contains an MSI. I don't have and HP machine to test with so I can't help you much from that point, but you should be able to use something like the following command to install. msiexec.exe /i HPHKS.msi ALLUSERS=1 REBOOT="ReallySuppress" /qn.
But some additional actions were required:
Cause
As it turns out, the UCS MP requires a Run As Account and uses that Run As Account in a related Run As Profile. Per Cisco UCS systems one Run As Profile is required. For the first Cisco UCS system the Run As Profile was properly configured. But for the other Cisco UCS systems the related Run As Profiles were empty.
Solution
By adding the proper Run As Account to the Run As Profiles for the related Cisco UCS systems, these systems were properly discovered and monitored as well.
The beginning
I don’t know about you. But even though I like my native language (Dutch) a lot, I prefer English when working with IT related stuff. Localized versions of Windows for instance aren’t my thing at all. Just give me the English version please ![]() . So when the SCCM 2012 R2 Console opened like this on a W7 workstation at a customers location I wasn’t happy at all:
. So when the SCCM 2012 R2 Console opened like this on a W7 workstation at a customers location I wasn’t happy at all: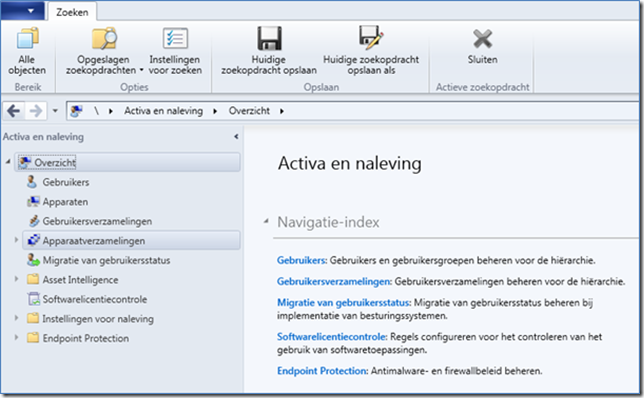
Ouch! This isn’t going to work for me at all. Time for a change.
The challenge
The SCCM 2012x Console comes with different languages. Based on the language used by the OS, the SCCM 2012x Console is loaded in the same language (provided the language is present for the SCCM 2012x Console).
This thread on the TechNet Forum for SCCM 2012x tells it all: ‘ …Each time the Configuration Manager console opens, it determines the configured language settings for the computer, verifies whether an associated language pack is available for the Configuration Manager console, and then opens the console by using the appropriate language pack. When you want to open the Configuration Manager console in English regardless of the configured language settings on the computer, you must manually remove or rename the language pack files on the computer…’
So when you want to change the language of the SCCM 2012x Console, you should have to change the language used by the OS as well. For this customer this couldn’t be done. So that was not an option. Time for another approach.
Quick & dirty but WITH the anticipated results…
As it turned out there is a quick and dirty fix for it:
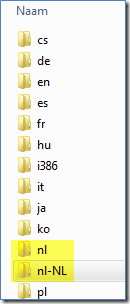

When the SCCM 2012x Console is started it will use English instead: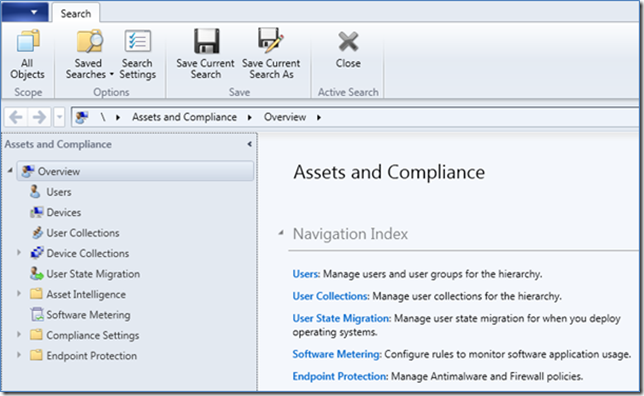 `
`
So whenever the SCCM 2012x Console uses a language you don’t want, use this approach an be happy.
The beginning
When I started blogging at the end of 2008 I never expected to gain that much traction. However, things started out small and now – on a daily basis – my blog gets between 900 and 1100 visitors on normal working days, depending on the postings I write. And even in the weekends my blog gets an average of 250+ visitors per weekend day.
Humble & grateful
These are awesome numbers and makes me humble. Since all I do is sharing my experiences from the trenches with SCOM and lately with SCCM as well. It’s YOU, the visitor who decides to visit my blog and spend your valuable time. Not only to read my postings but also to comment. And because of those comments I learned a lot which I use on a daily basis. So I say thank you all.
On top of it all I made many new friends, all around the world. UK, Ireland, Spain, Portugal. But also further from Europe, like China, USA, Russia, New Zealand and Austria. Some of those people moved on and with others even a friendship came to be. So this makes me even more grateful.
Wow!!!
And today I noticed that my blog has passed the magic number of One Million visitors:
Now and later
Even though it’s sometimes hard to find time to write new postings, I still have a lot of things to share with the community. So I won’t stop blogging. Ever. Format and focus might change of my blog, but blogging is what I do and I won’t stop with it as long as the blog gets enough visitors. Since that tells me whether what I do is relevant and makes sense and a difference.
A BIG thanks to YOU as a visitor of my blog
But seriously, all the credits go to YOU, as a visitor of my blog. Without you I would have stopped blogging some years ago. As long as you keep visiting my blog and sending your comments, I’ll keep on going, pushing the envelope, trying to find the perfect balance between work, private life and blogging. Many times it’s a challenge but tempting none the less.
Update 2014-11-04: A good friend of mine, Oleg Kapustin, has written a posting about the Exchange MP as well. Since he’s a real good developer he has some additional insights in this MP. So for anyone using this MP, I highly recommend to read his posting as well, to be found here. Especially the part about ‘playing with the interval parameters’ is very interesting…
The first version of the Exchange Server 2013 MP…
We all know that the first version of the Exchange Server 2013 MP missed out on a lot of details. It reduced SCOM to nothing but a reporting tool since Exchange Server 2013 is expected to manage and monitor itself. So no additional monitoring by SCOM was required. It only needed to pick up the statuses and Alerts created by Exchange Server 2013 itself and that was it. And whenever something happened, Exchange would remedy itself…
In scenarios where organizations run many Exchange Servers (think about topologies with 100+ Exchange servers at least) and where are dedicated Exchange engineers available, an approach like this could work. Also self remediation could work in a scenario like this.
But how about smaller organizations, running less than 25 Exchange servers where the engineers have to keep a plethora of systems up and running, among them Exchange? So additional knowledge, like most of the SCOM Alerts contain, is very welcome.
In a situation like this the previous version of the Exchange Server 2013 MP didn’t deliver so Microsoft got a lot of criticism. Also from me…
The new version is here…
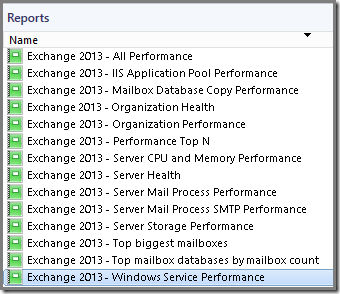
At TechEd Europe 2014 Microsoft presented the newest version of the Exchange Server MP, version 15.0.652.19. When looking at the version numbers it looks like much hasn’t changed since only the last digits are changed (the previous version was on level 15.0.652.18).
However, MUCH has changed, so the version number is not telling the whole story here ![]() . Some examples:
. Some examples:

Verdict
Microsoft has shown to LISTEN to its customers. Even though this MP still uses Exchange Server 2013 to monitor itself, there is much to say about this approach. Why create a duplicate burden on those servers by running the same monitoring workloads twice (Exchange itself and the related MP)?
Point is that SCOM should be the single pane of glass for the organization using it to monitor the health of their IT systems and services, whether on-prem or cloud based (Azure, AWS and so on).
For what I’ve seen and heard so far, the latest version of this MP is a huge improvement compared to the previous version. So this is good news. I really hope the website Microsoft uses for providing additional information on the Alerts and how to solve them is just as good as this MP. Future will tell.
And don’t be afraid to share your personal experiences with this MP.
SCOM 2012 R2 UR#2 (and later) only!!!
For now this MP only runs in a SCOM 2012 R2 UR#2 (or later) environment. Later on a version for SCOM 2012 SP1 UR#x will be published, date unknown so far.
Where to download from?
MP can be downloaded from here. When interested in some screenshots of this new MP, visit this blog posting of Daniel Savage, Microsoft PM for the MPs.
Until now this version isn’t available from the MP Catalog available from the SCOM Console. It contains the old version: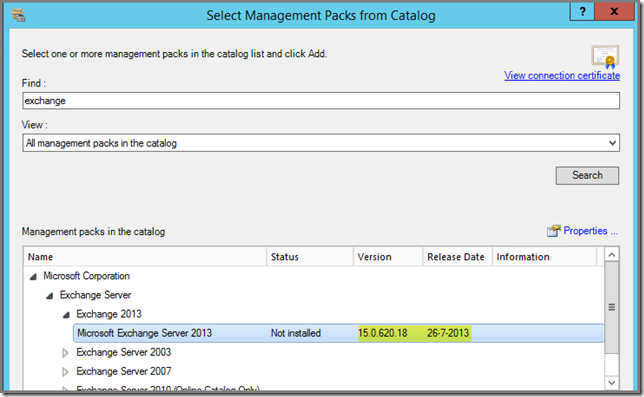
I expect this to be fixed soon.