Thursday, September 17, 2015

Updated MPs: WS2012 DHCP & ADS

A few days ago Microsoft released updates for these two MPs:

  • Windows Server 2012 DHCP
    • Version: 6.0.7295.0
    • Change: ‘…The properties view of Failover Server Relationship did not display all the IP addresses, with this fix the properties view of Failover Server Relationship will display all IP addresses…’
    • Download location: http://www.microsoft.com/en-in/download/details.aspx?id=39062

  • Windows Server 2012 Active Directory Domain Services
    • Version: 6.0.8321.0
    • Change: ‘…The “AD_Op_Master_Response.vbs” script in the Active Directory Domain service MP failed on some environments where region for local system is set to a non EN-US locale. This was due to a date field not bring stored in registry in the date format of the region/locale. With this fix, the script doesn't fail when region is to to a non EN-US locale…’
    • Download location:http://www.microsoft.com/en-in/download/details.aspx?id=21357

Like all other MPs: Test them before putting them into production.

New Community MP: Monitor & Reduce Health Service Store Size

At the beginning of this month Jimmy Harper released a new MP for the community. This MP monitors the Health Service Store size and can even reduce it.

On many servers this is not an issue. But sure enough you’ve got a few servers with very limited disk space. So every MB saved is welcome. In occasions like these it certainly pays of to reduce the size of the Health Service Store.

Normally you have to do this by hand. Jimmy Harper has developed a MP which monitors, collects and reduces the size of the Health Service store file.

Want to know more? Go here, read Jimmy’s posting and download the MP for FREE!

Thanks Jimmy for sharing this MP with the community.

Updated MP: OpsMgr Self Maintenance MP Version 2.5.0.0

Yesterday the king of MP authoring, Tao Yang released an updated version of the OpsMgr Self Maintenance MP, version 2.5.0.0.

And (again) I am VERY impressed. The previous version was already awesome and something which should be PRESENT in ANY SCOM 2012x environment, but this update even got better. Besides some bug fixes it contains new features as well.

Please be advised to READ the guide of this MP from cover to back.
Since good tuning/configuration is required in order to get the most out of it.
Therefore RTFM is key here.

Even though it might take some time it’s worth the effort since it’s like ‘Set & Forget’. So when the tuning/configuration phase is done, this MP will do what the name tells you: Making SCOM 2012x to maintain itself! Just awesome a MP like this comes for FREE!

Thanks Tao for sharing this totally AWESOME MP with the community!

Monday, September 14, 2015

Repost/Cross Post: Dynamic OM12 R2 Groups WITH Heartbeat Alerts

Issue
When creating dynamic Groups containing Windows Servers for instance, you WON’T get an Alert when one of those servers is down. Ouch! When you don’t know that, it’s something which is going to bite you sooner or later.

Cause
There is always a WHY to something and this case isn’t different. YES, SCOM does check on the availability of the monitored Windows Server. Sure. But it does that kind of monitoring on a whole different Class.

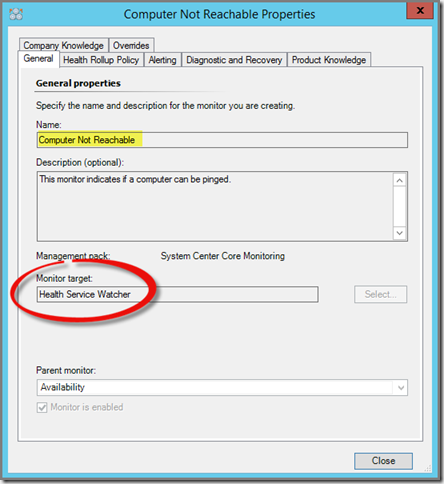
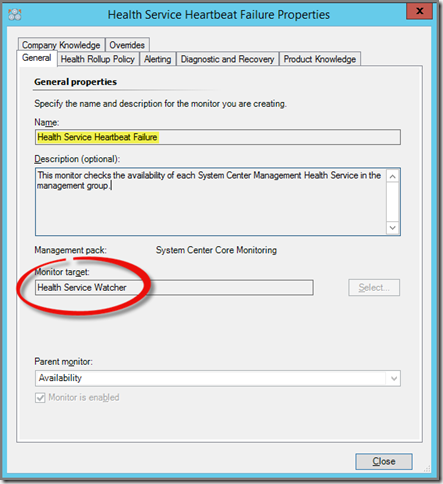
As we all know, SCOM is all about Classes. And the Monitors which check for the availability of the Microsoft Monitoring Agent (MMA) and the related Windows Computer are targeted against the Health Service Watcher Class, and not against the Windows (Server) Computer Class:

Health Service Heartbeat Failure Monitor:
image

Computer Not Reachable Monitor:
image

As a result, when creating a dynamic Group in SCOM only containing Windows Server objects, and using this Group in your notification model, you WON’T get an Alert when one of those servers goes down. Sure, other Alerts will do come up, but not an Alert like ‘Health Service Heartbeat Failure’ or ‘Failed to Connect to Computer’, while these Alerts do show you the root cause right away…

What to do about it?
Sure. You can get angry/frustrated with it and go on with your life. However, it’s SCOM remember? So with a bit copying and pasting XML you can achieve a lot!

No! MANUALLY adding the related Health Service Watcher object to this dynamic Group won’t fly. We WANT a dynamic Group remember? A ‘set-and-forget’ Group by knowing this Group will always contain the correct members, AUTOMATICALLY.

So the initial investment will be a bit bigger, but when done, you’re truly done here.

Spoiler
This posting isn’t based on a brain wave I got. But just looking on the internet for the right resources. And after some good searching I found what I needed. At the end of this posting I’ll share the resources I used and give credit to the people who deserve it.

Solution
Easy. Follow these few steps by example and you’ll be fine.

  1. Create a Dynamic Group which is dynamically populated with the Windows Computer objects. E.g: Example Group with this Dynamic Inclusion Rule:
    image
    Basically ALL Windows Computers monitored by SCOM are added automatically to this Dynamic Group.
  2. Checking the members:
    image
    As you see, Windows Computer objects only.
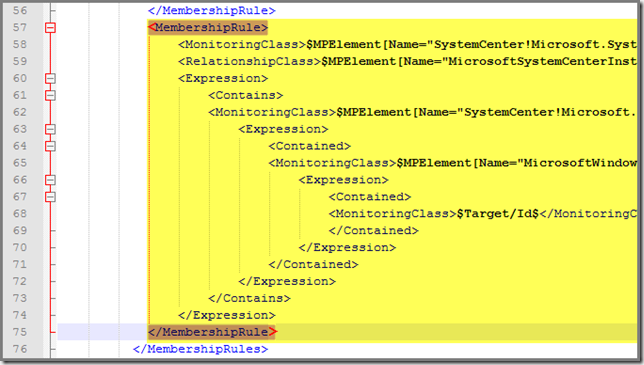
  3. Export the MP containing this Group, open the related XML in Notepad++ (for instance) and add this additional XML code between the tags </MembershipRule> and </MembershipRules>. So you’ve got something like this:
    Add the code where the red arrows point at:
    image

    You got something like this:
    image
  4. Increment the version number so you can differentiate between both versions of this MP. Save the modifications and import this updated version into your SCOM MG.
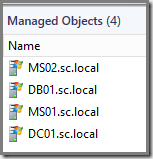
  5. Check the Group members:
    image
    Yeah!

Caveats
So this REALLY works. However, there are some caveats to reckon with:

  1. Since you edited the underlying XML of this Group you CAN’T edit it anymore in the SCOM Console:
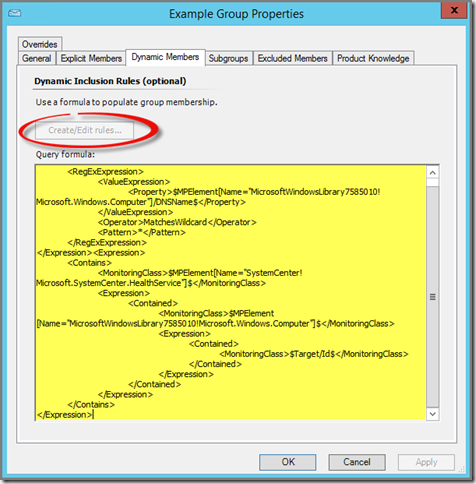
    image 
    The Create/Edit rules button is greyed out AND do you recognize the Query formula? Exactly, it’s the XML code you just added!
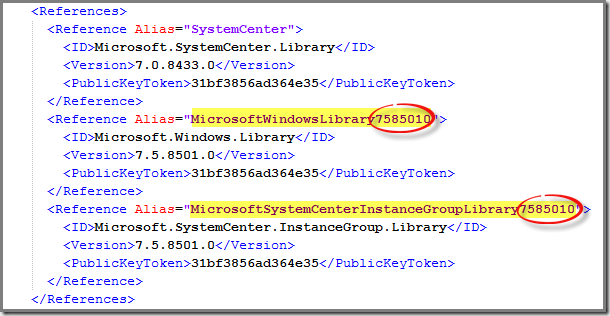
  2. The previously mentioned XML code ONLY works for SCOM 2012 R2! When running OM12 SP1 you’ll need to change the version numbers from 7585010 to 7084300.
  3. The modification of the numbers goes for SCOM 2012 RTM. I don’t know the numbers but you can find them in the XML code of the MP, under the header <References>. Look for the Aliases for Microsoft.Windows.Library and Microsoft.SystemCenter.InstanceGroup.Library. Here you’ll find the correct numbers:
    image
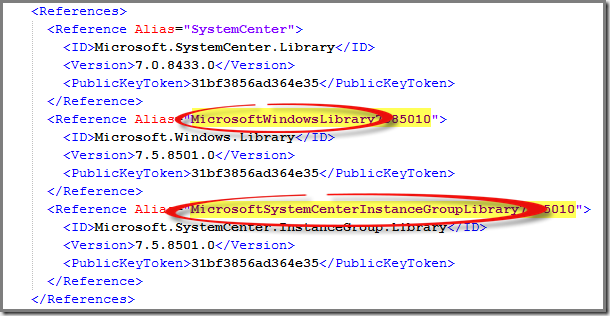
  4. Sometimes your MP will use other references ALIASES. So check them in your MP whether they’re correct. When not, adjust the XML code in accordingly:
    image

Used resources
As stated before, this posting came to be by using other resources, in chronological order:

  1. A posting written by Tim McFadden;
  2. A posting written by Jonathan Almquist.;
  3. TechNet Forum for SCOM, thread 01;
  4. TechNet Forum for SCOM, thread 02 (Thanks Marthijn van Rheenen).

So ALL credits for this posting goes to these guys. Thanks men!

Wednesday, September 9, 2015

One Small Footprint For a Server, One Giant Leap For OMS

Welcome to the new world
Microsoft is reinventing itself. It’s in a huge transition from a company previously focused on ‘devices & services’ to an enterprise geared to the ‘mobile-first, cloud-first’ mantra. Even though Microsoft has brought marketing to a whole new level, in this particular case there isn’t much marketing mumbo jumbo, if none at all.

The investments and speed of development in Microsoft’s cloud offering is unprecedented, all across the ‘Azure board’. New features are added on an almost weekly basis to the whole Azure port folio. Some are kept low key (like the Clutter feature in Office 365) where as others do get a bigger exposure.

Fact is that Azure is an ever evolving cloud environment gaining more traction by the day. Microsoft’s whole workforce has shifted their direction and are working in unison for the development of the cloud.

OMS has the same speed of development
OMS makes no difference here. Quite recently Microsoft introduced a new feature in OMS: Near real-time performance data collection. At a first glance it might seem like a minor step, but – after having tested it thoroughly – it’s a giant leap for OMS.

I’ll tell you why.

NRT & supposed impact
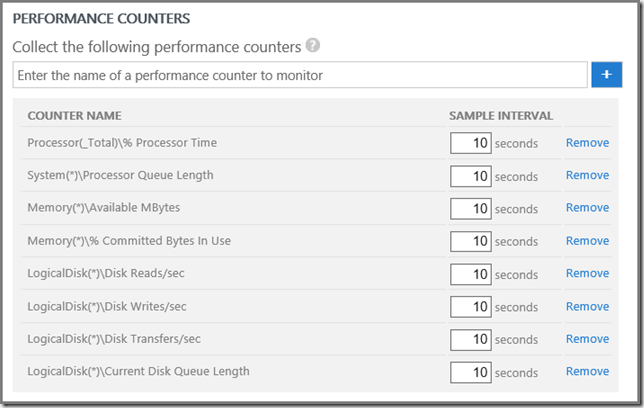
The intervals for  near real-time (NRT) performance data collection by OMS is set by default to 10 seconds. Which makes sense since the name of the new feature implies ‘near real-time’.

Being someone with a SCOM background it made me wonder about the footprint of it all. How about memory and CPU load?. How about network load? In other words, what kind of footprint does OMS with NRT performance data collection has on any given server?

Time to put it to the test.

The test environment
Any test is just as good as the environment used for it, together with the applied test scenario. So I decided to deploy in my own test lab two brand new VMs, identical to each other. Also I deployed a new OMS Workspace in order to ascertain the test wasn’t ‘contaminated’ with old settings I tested in my other OMS workspaces.

Items:

  1. 2 identical Windows 2012 R2 VMs (3 GB RAM, 1 vCPU, 1 logical drive C:\, workgroup member), NRT01 and NRT02;
  2. Both VMs placed on the same Hyper-V host, using the same storage, compute and network resources;
  3. One new OMS workspace, named NRTLab.

Item configuration:

  1. Server NRT01 got the Windows Agent, downloadable from the OMS workspace NRTLab (the Windows Agent is the Microsoft Monitoring Agent (MMA) with OMS Workspace connection capabilities);
  2. The Windows Agent on NRT01 connects ONLY to the NRTLab OMS Workspace;
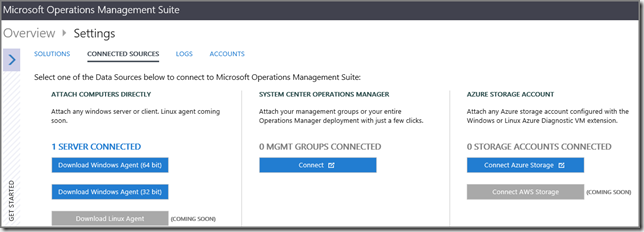
  3. NRTLab isn’t connected to any SCOM 2012 Management Group nor any Azure Storage Accounts:
    image
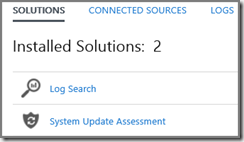
  4. NRTLab Solutions configuration: Log Search and System Update Assessment:
    image
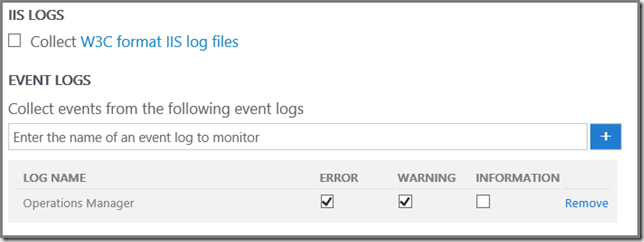
  5. NRTLab Logs configuration. Log Name: Operations Manager (Error & Warning):
    image
  6. NRTLab NRT Performance Data Collection settings. OMS default with the default sample interval:
    image
  7. NRTLab is happy and reports a 100% complete configuration:
    image
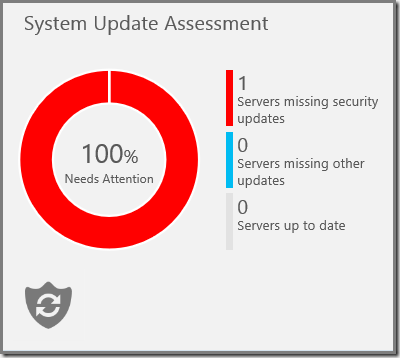
  8. And yes, NRT01 is connected properly to NRTLab and data is coming in:
    image

    image

Now I’ve got enough resources to run a good test. How about a valid test scenario?

Test scenario
Say what? NRT02 has NO Windows Agent? Yes, that’s correct! This server has only ONE purpose: it’s a reference server!

Now I can see what kind of CPU, RAM and network load this server has compared to NRT01 running the Windows Agent reporting to NRTLab while collecting NRT performance data, OpsMgr event log entries (errors & warnings) & checking whether the server is missing out on any crucial updates (performed by the System Update Assessment Solution).

On both servers I defined a new Data Collector Set in Performance Monitor, in order to collect specific performance data:

NRT01

  • Logical Disk > Current Disk Queue Length (C:);
  • Memory > Available MBytes
  • Network Adapter > Bytes Total/Sec
  • Network Adapter > Current Bandwidth
  • Process > % Processor Time (HealthService.exe & MonitoringHost.exe)
  • Process > IO Data Operations/sec (HealthService.exe & MonitoringHost.exe)
  • Process > Working Set – Private (HealthService.exe & MonitoringHost.exe)
  • Processor Information > % Processor Time

NRT02

  • Logical Disk > Current Disk Queue Length (C:);
  • Memory > Available MBytes
  • Network Adapter > Bytes Total/Sec
  • Network Adapter > Current Bandwidth
  • Process > % Processor Time (_Total)
  • Process > IO Data Operations/sec (_Total)
  • Process > Working Set – Private (_Total)
  • Processor Information > % Processor Time

I had these Data Collector Sets running for about 24 hours. No programs were opened, all MMC’s were closed (Performance Monitor included!), so these servers were simply running without being used except for their own running processes and services.

I ran these Data Collector Sets multiple times in order to establish a baseline. The results in this posting are based on the last run, from 20:43 9/7/2015 until 21:21 9/8/2015.

The results
And I must say this is the very reason I run the Data Collector Sets multiple times. Simply because the results are very impressive.

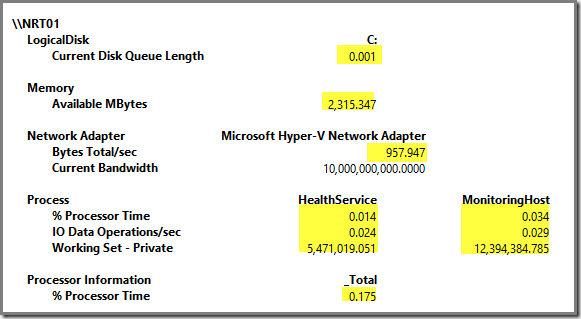
Seeing is believing, so let’s take a look at the Report View of the Report of both Data Collector Sets:

NRT01
image

NRT02
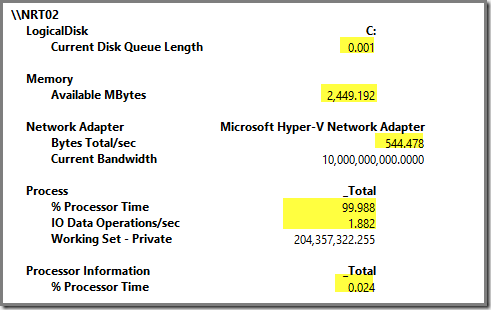
image

As you can see is the memory footprint of the Windows Agent really small. With the counter Process / Working Set – Private we see the number of bytes in use for both components of the Windows Agent, comprised of HealthService.exe (5.2 MB) and MonitoringHost.exe (11.8 MB).

This means that together (the Windows Agent actually) uses 17 MB of RAM! I don’t know about you, but to me that’s really small.

Looking at the CPU footprint you can see it’s small as well. The Windows Agent consumes about 0.151 % Processor Time (% Processor Time NRT01 – % Processor Time NRT02).

When looking at process level, we see that HealthService.exe consumes 0.014 % Processor Time and MonitoringHost.exe 0.034. Together even less than 0.05 (0.048)!

And the load on the network (Bytes Total/sec) is also very low: 413.469 Bytes Total/sec (0.00039 Megabyte!) for the Windows Agent Bytes Total/sec NRT01 – Bytes Total/sec NRT02).

But how about the network load for NRT Performance data collection only? The OpsMgr Engineering Team states: ‘… for a particular computer, a given counter instance (e.g., Processor(_Total)\% Processor Time) with 10 second sample interval will send ~1MB per day (~1MB/day/counter instance)…’.

I contacted Microsoft about this and they told me this is UNCOMPRESSED data! Since it get’s compressed these values are even lower! And they assured me this is thoroughly tested and triple checked.

Recap
I am amazed! Never ever I expected to see such a SMALL footprint of the OMS Agent (AKA Windows Agent) on any given monitored server.

Since OMS uses a cloud based state of the art back end for data processing it doesn’t have the potential bottle necks we may see with on-prem SCOM installations. So data comes in, is processed very fast and shown in your OMS workspace in the matter of seconds. Now that’s NEAR REAL-TIME!!!

Since the footprint of OMS is so small I see no reason NOT to use OMS on any important server. Connect the Windows Agent with an on-prem SCOM environment and you’ve got the best of both worlds: on-prem SCOM and state of the art (and ever evolving) OMS in the Cloud!

Check it your self
Both Performance Monitor Reports used for this posting can be downloaded from my OneDrive and opened in Performance Monitor, so you can see it for yourself: NRT01 and NRT02.

But even better, start using OMS today and see what it can do for your environment.
Monday, September 7, 2015

Comparing SCOM And OMS = Comparing Apples And Oranges

Okay. Running a blog is something I really like. But with it do come certain responsibilities. Like keeping the blog clean of anything based on assumptions and lacking good investigation.

Until recently I succeeded in this approach. However, last week I posted an article which fell below that standard. This posting was about the newest feature in OMS, near real-time performance data collection.

In this posting I assumed this kind of near real-time performance data collection would have a noticeable impact on the performance of the monitored servers. Also I compared it to some performance collection Rules present in the Windows Server OS MP, used by SCOM.

As it turned out I was wrong on both accounts. Both assumptions were based on my SCOM experiences. However, as it turns out OMS is a whole different kind of beast (no pun intended!), even though it runs a Microsoft Monitoring Agent (MMA) and uses Intelligence Packs. So the look & feel might be a bit like SCOM but under the covers it works totally different compared to an on-prem SCOM solution.

I want to say sorry to all the readers of this blog, Microsoft included. Simply because you expect here to find information, based on facts and not on assumptions. This particular posting failed on that account.

So I’ve pulled the old posting and will replace it soon by a new one, all about the footprint of the OMS Agent on a server, collecting near real-time performance data using the default interval of 10 seconds. This posting won’t be based on assumptions but on some serious testing.

During the week-end I had more time to put things to the test. This way I’ve found out that OMS has a significant smaller footprint on the monitored servers than I previously assumed.

Spoiler Alert
In the week-end I rolled out in my own lab two identical servers (NTR01 and NTR02), both running Windows Server 2012 R2. Same disk, CPU and RAM configuration.

In OMS I created a new Workspace (NRTLab), especially for this test. From this new OMS Workspace I downloaded the Microsoft Monitoring Agent (MMA) and installed it ONLY on the NRT01 server. The NRT02 server is purely a reference server. It has NO MMA what so ever.

In the new OMS Workspace I configured ONLY the collection of the OpsMgr event logs (error and warnings), the default set of performance counters WITH their default sample interval of 10 seconds and last (but not least), the System Update Assessment Solution.

On both servers I defined a new Data Collector Set in Performance Monitor, all aimed at collecting specific performance data (CPU, memory, NIC and process related items) in order to get a better and detailed understanding of the footprint of the OMS MMA in general, and the collection of real time performance data specifically.

And I must say that I am really IMPRESSED about how small that footprint is. About an hour ago I restarted the Data Collectors on both servers for the last time so I’ve got multiple test results to ‘read’ and translate into a new blog posting.

So stay tuned!

Service Manager: Improving Performance

The Service Manager engineering team has posted an article all about one of their key areas: Improving performance of Service Manager.

In this posting they’re asking YOU to up vote on some scenarios which they’ve opened on Connect related to performance gaps in Service Manager.

When you’re using Service Manager AND want to have a say in what the team needs to prioritize in order to improve the performance of Service Manager go here.

Free Virtual Azure Event: AzureCon

On September 29th Microsoft organizes the virtual Azure Event AzureCon. This event is FREE to attend.
image

It has 3 keynotes and over 50 technical breakout sessions! So my advice is: JOIN this event since it will be packed with loads of information about Azure. Not only the current state will be discussed/shown/demonstrated but also the roadmap will be shared during the keynote.

Since Azure is the new Microsoft, anyone working with Microsoft based technologies will find here good information.

Thursday, September 3, 2015

Cross Post: Visual Studio Management Pack Authoring Series

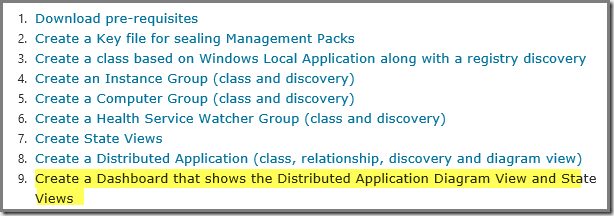
Wow! This is TOTALLY awesome! Graham Davies has posted an almost COMPLETE series all about MP authoring using Visual Studio with the Authoring Extensions, AKA VSAE:
image
(The yellow highlighted part will be posted soon I guess…)

His approach is simple: Not duplicating other good postings written by other SCOM heroes, but instead referring to those sources and adding his own ideas to the mix.

For serious MP authoring there is – to be frank – only VSAE. Yes, there is the Microsoft/Silect solution which covers some basic stuff, but when you want to get serious with MP authoring, VSAE is the only tool in town.

With the new series written by Graham you’ve got an excellent starting point for beginning with VSAE.

OM12x & Visio Add-In & Outdated Windows Azure MP: ‘Client not supported’

Issue
When running an outdated version of the Windows Azure MP (version 1.0.0.0) in your SCOM environment, the SCOM Visio add-in won’t work.

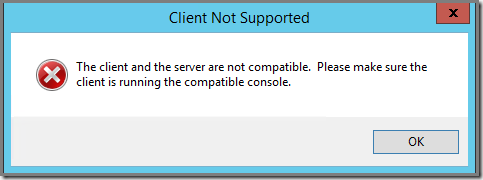
When trying to configure it, this error message will be shown: Client not supported.The client and server are not compatible. Please make sure the client is running the compatible console.
image

Fix
This one is simple: UPDATE the Windows Azure MP to the latest version (1.1.238.0). After the update the SCOM Visio add-in will work.

Recap
I do understand that organizations decide not to update the MPs as soon as an update comes out. Good testing is required AND advised. However, NOT updating the MPs isn’t a good choice either.

Wednesday, September 2, 2015

SCOM MP Tip: System Center Core Blog

Whenever you want to dig in deep into a MP, this is a blog to reckon with: System Center Core. It contains the technical documentation for all Microsoft MPs (the latest versions) and many non-Microsoft MPs, including their download links.

Whenever you want to know how a MP is constructed this is THE place to be. I’ve used this website many times but somehow forgot to share it.

A BIG word of thanks to the person/persons maintaining this awesome website.